
Allergies
An allergy may be a damaging immune response by the body to a substance, especially pollen, fur, a particular food, or dust, to which it has become hypersensitive.
The graph on the right was composed using data collected between 1979 and 1982.[1]
Effects of El Niño
[edit | edit source]
"El Niño and La Niña intensity data is based on a year extending, roughly, from July of one year to June of the following year. Accordingly, I formed 12-month averages of global mean surface temperature anomalies from HadCRUT data extending from July to June, rather than the conventional calendar-year averaging."[2]
La Niña causes mostly the opposite effects of El Niño: precipitation in the southwestern and southeastern states, as well as Southern California, is below average.[3]
La Niña is a complex weather pattern that occurs every few years, as a result of variations in ocean temperatures in the equatorial band of the Pacific Ocean,[4] The phenomenon occurs as strong winds blow warm water at the ocean’s surface away from South America, across the Pacific Ocean towards Indonesia.[4] As this warm water moves west, cold water from the deep sea rises to the surface near South America;[4] it is considered to be the cold phase of the broader El Niño–Southern Oscillation (ENSO) weather phenomenon, as well as the opposite of El Niño weather pattern.[4]
Tropical instability waves visible on sea surface temperature maps, showing a tongue of colder water, are often present during neutral or La Niña conditions.[5]
La Niña events have occurred for hundreds of years and occurred on a regular basis, during the early parts of both the 17th and 19th centuries.[6]
Since the start of the 20th century, La Niña events have occurred during the following years:
- "La Niña years". http://www.noaanews.noaa.gov/stories/s300c.htm The NOAA News. U.S National Oceanographic and Atmospheric Administration. Retrieved 20 April 2016.
- La Niña and winter weather (Report). http://www.nws.noaa.gov/om/winter/la_nina-q-a.shtml U.S. National Oceanic and Atmospheric Administration. Retrieved 14 March 2014.
- ENSO Impacts on the U.S. – Previous Events. https://web.archive.org/web/20101206141055/https://www.cpc.ncep.noaa.gov/products/analysis_monitoring/ensostuff/ensoyears.shtml Climate Prediction Center. cpc.noaa.gov (Report). Monitoring & Data. U.S. National Oceanic and Atmospheric Administration. 4 November 2015. Archived from the original on 6 December 2010. Retrieved 3 January 2017.
- "La Niña Information". Public Affairs. https://web.archive.org/web/20140812112241/http://www.publicaffairs.noaa.gov/lanina.html U.S. National Oceanic and Atmospheric Administration. Archived from the original on 12 August 2014. Retrieved 31 May 2010.
- Sutherland, Scott (16 February 2017). "La Niña calls it quits. Is El Niño paying us a return visit?". https://www.theweathernetwork.com/us/news/articles/la-nina-calls-it-quits-is-el-nino-paying-us-a-return-visit/79424 The Weather Network. Retrieved 17 February 2017.
- "El Niño/Southern Oscillation (ENSO) diagnostic discussion" (PDF). https://www.cpc.ncep.noaa.gov/products/analysis_monitoring/enso_advisory/ensodisc.pdf Climate Prediction Center / NCEP / NWS and the International Research Institute for Climate and Society. 10 September 2020. Retrieved 10 September 2020.
Each forecast agency has a different criteria for what constitutes a La Niña event, which is tailored to their specific interests.[7]
For example, the Australian Bureau of Meteorology looks at the trade winds, SOI, weather models and sea surface temperatures in the Niño 3 and 3.4 regions before declaring that a La Niña event has started.[8]
However, the Japan Meteorological Agency declares that a La Niña event has started when the average five-month sea surface temperature deviation for the NINO 3 region is more than 0.5 °C (0.90 °F) cooler for six consecutive months or longer.[9]
- 1903–04
- 1906–07
- 1909–11
- 1916–18
- 1924–25
- 1928–30
- 1938–39
- 1942–43
- 1949–51
- 1954–57
- 1964–65
- 1970–72
- 1973–76
- 1983–85
- 1988–89
- 1995–96
- 1998–2001
- 2005–06
- 2007–08
- 2008–09
- 2010–12
- 2016
- 2017–18
- 2020–22
Theoretical allergies
[edit | edit source]Def. a "disorder of the immune system causing adverse reactions to substances (allergens) not harmful to most and marked by the body's production of histamines and associated with atopy, anaphylaxis, and asthma"[10] is called an allergy.
Pollen allergy in Europe
[edit | edit source]"The allergenic content of the atmosphere varies according to climate, geography and vegetation. Data on the presence and prevalence of allergenic airborne pollens, obtained from both aerobiological studies and allergological investigations, make it possible to design pollen calendars with the approximate flowering period of the plants in the sampling area."[11]
"Aerobiological and allergological studies show that the pollen map of Europe is changing also as a result of cultural factors (for example, importation of plants such as birch and cypress for urban parklands), greater international travel (e.g. colonization by ragweed in France, northern Italy, Austria, Hungary etc.) and climate change. In this regard, the higher frequency of weather extremes, like thunderstorms, and increasing episodes of long range transport of allergenic pollen represent new challenges for researchers."[11]
"Pollen allergy has a remarkable clinical impact all over Europe, and there is a body of evidence suggesting that the prevalence of respiratory allergic reactions induced by pollens in Europe has been on the increase in the past decades (1–6)."[11]
"The prevalence of pollen allergy is presently estimated to be up 40%. Exposure to allergens represents a key factor among the environmental determinants of asthma, which include air pollution (8)."[11]
"In Europe, the main pollination period covers about half the year, from spring to autumn, and the distribution of airborne pollen taxa of allergological interest is related to five vegetational areas":[11]
- Arctic: birch
- Central: deciduous forest, birch, grasses
- Eastern: grasses, mugwort, ragweed
- Mountains: grasses (with a pollination season delayed by three-four weeks in comparison with areas at sea level)
- Mediterranean: Parietaria, olive trees, grasses and also cypress
Gramineae
[edit | edit source]"The grass family (Gramineae) comprises more than 600 genera and over 10 000 species, of which more than 400 herbaceous, wind-pollinated plants are found in Europe (15). The most abundant airborne grass pollen originates from tall meadow grasses such as timothy (Phleum pratense), orchard grass (Dactylis glomerata), or meadow foxtail (Alopecurus pratensis). Cultivated rye (Secale cereale), which has remarkably high pollen production, is another potent source of allergens (16). However, with very few exceptions, all grass-pollen types show a very high degree of cross reactivity (17, 18)."[11]
"Grass allergens induce mostly nasal and conjunctival symptoms. Djukanovic et al. (21) provided evidence that natural exposure to grass pollen may exacerbate asthma, and, so, induce an inflammatory response involving T cells, mast cells and eosinophils."[11]
Trees
[edit | edit source]"The most allergenic tree pollen is produced by birch (Betula) in north, central, and eastern Europe, and by Olive (Olea europaea) as also cypress (Cupressus) in the Mediterranen regions."[11]
Fagales "comprises three families: Betulaceae, including the genera Betula (birch) and Alnus (alder); Corylaceae, including the genera Corylus (hazel), Carpinus (hornbeam), and Ostrya (hopbeam); Fagaceae, including the genera Quercus (oak), Fagus (beech), and Castanea (sweet chestnut)."[11]
A "high cross-reactivity exists within cupressacace family (Cupressus, Juniperus and Cryptomeria) and between Cupressacae and Taxacee (53–56) which have quite different pollination seasons, overlapping or preceding the cypress pollination period. This observation is of clinical importance, where cross-reacting and earlier flowering plants (C. arizonica is one of the most spread in several European areas) are well represented."[11]
Weeds
[edit | edit source]"Parietaria is the main allergenic genus of the Urticaceae (nettle) family. [...] The major allergens of both species are small glycoproteins with molecular weights ranging between 10 and 14 kDa, with high cross-reactivity (61). Recent findings showed that P judaica pollen contains an aminopeptidase which is able to disrupt epithelium barrier, enhancing the delivery of allergenic protein to dendritic cells (62)."[11]
An "increasing body of evidence support use of sublingual specific immunotherapy for subjects with symptoms due to Parietaria pollen (74, 75)."[11]
"The Compositae (Asteraceae), is one of the largest plant families with almost 20 000 species. Ragweed (Ambrosia) and mugwort (Artemisia) are the most involved in pollenosis"[11]
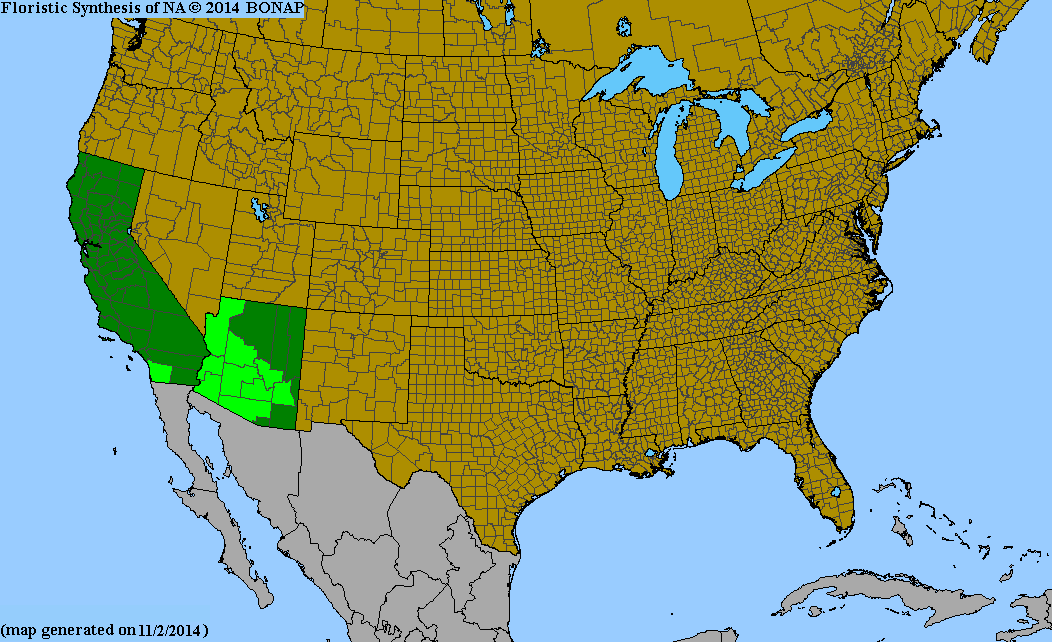
Ambrosia ambrosioides
[edit | edit source]
Ambrosia ambrosioides is found in the deserts of northern Mexico (Baja California, Baja California Sur, Chihuahua, Durango, Sonora), Arizona, and California (Ventura County, California + San Diego County, California).[12][13][14][15]
Flowering occurs mainly in February through April.
Ambrosia artemisiifolia
[edit | edit source].jpg)
Its bloom period is July to October in North America.[16] Its pollen is wind-dispersed, and can be a strong allergen to people with Allergic rhinitis (hay fever).[17][18]
Pathogenetics
[edit | edit source]"In the context of allergy, pollen grains have been simply regarded as allergen carriers, and little attention has been devoted to the nonprotein compounds of pollen. However, individuals are rarely exposed to pure allergens, but rather to particles releasing the allergen, such as pollen grains or pollen-derived granules (107–109). Notably, lipids are major components of pollen exine and exsudate (108). In addition, long chain unsaturated fatty acids in pollen, such as linolenic acid, serve as precursors for the biosynthesis of several plant hormones, such as dinor isoprostanes, recently termed phytoprostanes. These phytoprostanes are formed non-enzymatically via autooxidation in plants and structurally resemble prostaglandins and isoprostanes in humans (110–112)."[11]
"It has been demonstrated recently that pollen grain, under physiological exposure conditions, releases not only allergens but also bioactive lipids that activate human neutrophils and eosinophils in vitro (115–117). Moreover, intact grains of pollen induce activation and maturation of dendritic cells in vitro, suggesting that pollen can act not only as allergen carrier but also as an adjuvant in the induction phase of the allergic immune response (118)."[11]
Pollen allergen carrying small particles
[edit | edit source]"In the early 1970s, Busse et al. (125) were the first to demonstrate the presence of specific ragweed allergens carried by small particles. By different techniques, this observation was confirmed and extended, first to ragweed-pollen allergen (126–128). Subsequently, the same phenomenon was observed in grass-pollen allergen (129–131), red oak-pollen allergen (132), Japanese cedar-pollen allergen (133), and birch-pollen allergen (134). With cascade impactors or other instruments that fractionate the sampled airborne matter into several size classes, it was established that these small particles range from some micrometers, i.e. 2–10 μm (paucimicronic) to less than 1 μm (submicronic) sizes (127, 128, 131, 133, 134)."[11]
Testing
[edit | edit source]Allergy testing can help confirm or rule out allergies and consequently reduce adverse reactions and limit unnecessary avoidance and medications.[19][20] Correct allergy diagnosis, counseling and avoidance advice based on valid allergy test results is of utmost importance and can help reduce the incidence of symptoms, need for medications and improve quality of life.[20] A healthcare provider can use the test results to identify the specific allergic triggers that may be contributing to the symptoms. Ruling out allergies is as important as confirming them to limit unnecessary avoidance, worry and negative social impact.[21]
National Institutes of Health guidelines for the diagnosis and management of food allergy and the diagnosis and management of asthma recommend either RAST test (allergy blood testing) or skin prick testing to reliably determine allergic sensitization.[19][22]
For a skin prick test, a patient is pricked with a series of needles that contain extracts of allergic triggers, then the doctor looks for strong reactions like welts or red bumps to determine if the patient has allergies.[23]
See also
[edit | edit source]References
[edit | edit source]- ↑ Mary Kay O'Rourke and Michael D. Lebowitz (1984). "A comparison of regional atmospheric pollen with pollen collected at and near homes". Grana 23: 55-64. https://www.tandfonline.com/doi/pdf/10.1080/00173138409428877. Retrieved 19 February 2022.
- ↑ RCraig09 (27 August 2021). "Bar chart of global surface temperature, with bars color-coded by El Niño and La Niña intensity". San Francisco, California: Wikimedia Foundation, Inc. Retrieved 19 February 2022.
{{cite web}}: Check|author=value (help) - ↑ "ENSO Diagnostic Discussion". Climate Prediction Center. U.S. National Oceanographic and Atmospheric Administration. 2008-06-05. Retrieved 9 November 2007.
{{cite web}}:|archive-date=requires|archive-url=(help) - ↑ 4.0 4.1 4.2 4.3 "What are "El Niño" and "La Niña"?". National Ocean Service. oceanservice.noaa.gov. U.S. National Oceanographic and Atmospheric Administration. February 10, 2020. Retrieved 11 September 2020.
- ↑ "August 2016 ENSO update;Wavy Gravy". Climate.gov.uk. Retrieved 16 October 2021.
- ↑ Druffel, Ellen R.M.; Griffin, Sheila; Vetter, Desiree; Dunbar, Robert B.; Mucciarone, David M. (16 March 2015). "Identification of frequent La Niña events during the early 1800s in the east equatorial Pacific". Geophysical Research Letters 42 (5): 1512–1519. doi:10.1002/2014GL062997. https://escholarship.org/uc/item/3xt6x5fb.
- ↑ https://web.archive.org/web/20160322155232/https://www.climate.gov/news-features/blogs/enso/decembers-enso-update-close-no-cigar Becker, Emily (4 December 2014). "December's ENSO Update: Close, but no cigar". ENSO Blog. Archived from the original on 22 March 2016. Retrieved 4 April 2016.
- ↑ http://www.bom.gov.au/climate/enso/tracker/#tabs=About-ENSO-and-the-Tracker "ENSO Tracker: About ENSO and the Tracker". Australian Bureau of Meteorology. Retrieved 4 April 2016.
- ↑ http://ds.data.jma.go.jp/tcc/tcc/products/elnino/ensoevents.html "Historical El Niño and La Niña Events". Japan Meteorological Agency. Retrieved 4 April 2016.
- ↑ "allergy". San Francisco, California: Wikimedia Foundation, Inc. 22 February 2016. Retrieved 2016-02-29.
- ↑ 11.00 11.01 11.02 11.03 11.04 11.05 11.06 11.07 11.08 11.09 11.10 11.11 11.12 11.13 11.14 11.15 G. D'Amato, L. Cecchi, S. Bonini, C. Nunes, I. Annesi-Maesano, H. Behrendt, G. Liccardi, T. Popov, and P. Van Cauwenberge (September 2007). "Allergenic pollen and pollen allergy in Europe". Allergy 62 (9): 976–990. doi:10.1111/j.1398-9995.2007.01393.x. http://onlinelibrary.wiley.com/doi/10.1111/j.1398-9995.2007.01393.x/full. Retrieved 2017-01-07.
- ↑ Flora of North America Vol. 21 Page 12 Ambrosia ambrosioides (Delpino) W. W. Payne, J. Arnold Arbor. 45: 410. 1964.
- ↑ Raymond M. Turner, Janice E. Bowers, and Tony L. Burgess, Sonoran desert plants: an ecological atlas (Tucson: The University of Arizona Press, 1995) pp. 75–76
- ↑ Biota of North America Program 2014 county distribution map
- ↑ Calflora taxon report, University of California, Ambrosia ambrosioides (Cav.) Payne, ambrosia bursage, ambrosia leaved burbush
- ↑ Jepson eFlora (TJM2): Ambrosia artemisiifolia . accessed 26 August 2016.
- ↑ NPIN−Lady Bird Johnson Wildflower Center Native Plant Information Network: Ambrosia artemisiifolia
- ↑ Newscientist.com: "North American ragweed to bring autumn allergy misery to Europe."
- ↑ 19.0 19.1 Boyce, J et al., "Guidelines for the Diagnosis and Management of Food Allergy in the United States: Report of NIAID-Sponsored Expert Panel", J Allergy Clin Immunol 2010; 126: S1–S58.
- ↑ 20.0 20.1 National Institute for Health and Care Excellence, "Diagnosis and assessment of food allergy in children and young people in primary care and community settings", 2011. Retrieved 26 December 2019.
- ↑ Sampson, H et al., "Utility of food-specific IgE concentrations in predicting symptomatic food allergy", J Allergy Clin Immunol 2001; 107: 891–6.
- ↑ "NIH Guidelines for the Diagnosis and Management of Food Allergy in the United States. Report of the NIAID-Sponsored Expert Panel", 2010, NIH Publication no. 11-7700.
- ↑ Asthma and Allergy Foundation of America, "Skin Testing for Allergies", 25 June 2012. Retrieved January 2013.
External links
[edit | edit source]
Learn more about Allergies |