
Selected topics in finite mathematics/Maximum flow
A maximum flow on a directed graph is a problem in operations research to determine how much of a resource can be transported from a source vertex s to a sink vertex t.
Objectives
[edit | edit source]- Be able to find a maximum flow between two vertices in a graph with edges that are weighted and directed.
- Be able to justify that a flow is maximum using a cut. (Also known as a minimum cut)
Details
[edit | edit source]Consider a graph which is both directed and weighted. Label one node s, this will be the source of flow. Label another node t, this will be the target for the flow. To find a maximum flow means to use the capacities (weights) to determine how much flow can be transported from s to t.
There are many applications of this in the industrial world, such as for instance transporting goods from a manufacturing facility to distribution center or transporting water from a well to treatment plant.
One simple algorithm for finding a maximum flow is the following.
- Find a path from s to t.
- Push as much flow through the path as possible, updating the graph.
- Repeat until there is a cut separating s and t, along which all edges are at full capacity.
Note that if a cut is not achieved, you may need to modify some of the existing paths. This happens when the above process will stalls: there are no more obvious paths from s to t, but there is no full capacity cut either. In this case you will have to either try again with different paths, or use an edge backwards, as illustrated below.
| Original graph | After first path | Second path | Final graph |
|---|---|---|---|

|

|

|

|
| After the first path there are no obvious paths. However, as illustrated in the second path, edge AB can be used in the backward direction by reducing its flow. | |||
Examples
[edit | edit source]

- In figure E1 a graph is given. Note that this graph has directed edges between two nodes s and t. It has weights on each of the edges which denote the maximum capacity along each edge.
- In figure E2 a graph is given with a maximum flow illustrated.
- In figure E2, there are several cuts with capacity 5. One of these cuts crosses the two edges going into t. Another cut crosses the two horizontal edges in the middle of the graph. A third of these cuts crosses edges so, op, and pr.
- In figure E3 we find a maximum flow from vertex A to vertex G. There are four paths used to construct this flow, in each case shown in red.
| First path | Second path | Third path | Final path |
|---|---|---|---|

|

|

|

|
| Figure E3: Finding a maximum flow from A to G | |||
Nonexamples
[edit | edit source]
- In figure E4 a valid flow is given, but it is not maximum. Notice in particular that there are paths from s to t that are still partially unused. Also note that any attempted cut between s and t has at least one edge crossing it that is still partially unused.
FAQ
[edit | edit source]Homework
[edit | edit source]-
 Figure H1
 -
 Figure H2
 -
 Figure H3


- In figure E1, find a maximum flow and cut justifying that it is the maximum flow.
- In figure E3 a maximum flow is found. Find a cut to justify that this is a maximum flow.
- Find the maximum flow from s to t in figure H1
- Find the maximum flow from s to t in figure H2
- Find the maximum flow from s to t in figure H3
Homework Solutions
[edit | edit source]- The maximum flow in figure E1 is 15 units.
- A cut in the final path of figure E3 goes through AD, CD, DE, and EG
- The maximum flow is shown in figure S1 below. A corresponding cut goes through S1, 12, and 24.
- The maximum flow and corresponding cut are shown in figure S2 below.
- The maximum flow and corresponding cut are shown in figure S3 below.
-
 Figure S1
 -
 Figure S2
 -
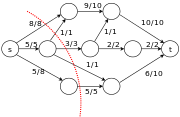 Figure S3


