
Portal:Jupiter/Radiation astronomy
Meteors


Jupiter has been called the Solar System's vacuum cleaner,[2] because of its immense gravity well and location near the inner Solar System. It receives the most frequent comet impacts of the Solar System's planets.[3]
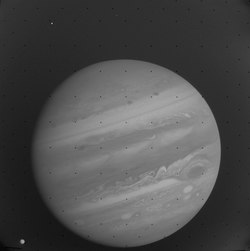
A 1997 survey of historical astronomical drawings suggested that the astronomer Cassini may have recorded an impact scar in 1690. The survey determined eight other candidate observations had low or no possibilities of an impact.[4] A fireball was photographed by Voyager 1 during its Jupiter encounter in March 1979.[5] During the period July 16, 1994, to July 22, 1994, over 20 fragments from the comet Shoemaker–Levy 9 (SL9, formally designated D/1993 F2) collided with Jupiter's southern hemisphere, providing the first direct observation of a collision between two Solar System objects. This impact provided useful data on the composition of Jupiter's atmosphere.[6][7]
On July 19, 2009, an impact site was discovered at approximately 216 degrees longitude in System 2.[8][9] This impact left behind a black spot in Jupiter's atmosphere, similar in size to Oval BA. Infrared observation showed a bright spot where the impact took place, meaning the impact warmed up the lower atmosphere in the area near Jupiter's south pole.[10]
A fireball, smaller than the previous observed impacts, was detected on June 3, 2010, by Anthony Wesley, an amateur astronomer in Australia, and was later discovered to have been captured on video by another amateur astronomer in the Philippines.[11] Yet another fireball was seen on August 20, 2010.[12]
On September 10, 2012, another fireball was detected.[5][13]
The second image at right shows the atmospheric impact sites for the Comet Shoemaker-Levy 9 fragments. Spectroscopic studies revealed absorption lines in the Jovian spectrum due to diatomic sulfur (S2) and carbon disulfide (CS2), the first detection of either in Jupiter, and only the second detection of S2 in any astronomical object. Other molecules detected included ammonia (NH3) and hydrogen sulfide (H2S). The amount of sulfur implied by the quantities of these compounds was much greater than the amount that would be expected in a small cometary nucleus, showing that material from within Jupiter was being revealed.
"A false-color composite image [first on the left] of Jupiter and its South Equatorial Belt shows an unusually bright spot, or outbreak, where winds are lofting particles to high altitudes in this image made from data obtained by the W.M. Keck telescope on Nov. 11, 2010."[14]
"The white clouds [in the second image down on the left], which get up to 50 miles (80 kilometers) wide or so, are high up in Jupiter's atmosphere — so high that they're very cold, and the material they shed is therefore almost certainly frozen."[15]
"It's snowing on Jupiter, and we're seeing how it works."[15]
"It's probably mostly ammonia ice, but there may be water ice mixed into it, so it's not exactly like the snow that we have [on Earth]. And I was using my imagination when I said it was snowing there — it could be hail."[15]
"This photo taken by NASA’s Juno spacecraft on May 19, 2017, at 5:50 UTC from an altitude of 5,500 miles (8,900 kilometers) shows high-flying white clouds composed of water ice and/or ammonia ice. In some areas, these clouds appear to form squall lines — narrow bands of high winds and storms associated with a cold front."[15]
References
- ↑ Dennis Overbye (24 July 2009). Hubble Takes Snapshot of Jupiter’s ‘Black Eye’. New York Times. http://www.nytimes.com/2009/07/25/science/space/25hubble.html?ref=science. Retrieved 25 July 2009.
- ↑ Richard A. Lovett (15 December 2006). Stardust's Comet Clues Reveal Early Solar System. National Geographic News. http://news.nationalgeographic.com/news/2006/12/061215-comet-stardust.html. Retrieved 8 January 2007.
- ↑ Nakamura, T.; Kurahashi, H. (1998). "Collisional Probability of Periodic Comets with the Terrestrial Planets: An Invalid Case of Analytic Formulation". Astronomical Journal 115 (2): 848–54. doi:10.1086/300206. http://www.iop.org/EJ/article/1538-3881/115/2/848/970144.html. Retrieved 2007-08-28.
- ↑ Tabe, Isshi; Watanabe, Jun-ichi; Jimbo, Michiwo (February 1997). "Discovery of a Possible Impact SPOT on Jupiter Recorded in 1690". Publications of the Astronomical Society of Japan 49: L1–L5.
- ↑ 5.0 5.1 Franck Marchis (10 September 2012). Another fireball on Jupiter?. Cosmic Diary blog. http://cosmicdiary.org/fmarchis/2012/09/10/another-fireball-on-jupiter/. Retrieved 11 September 2012.
- ↑ Ron Baalke. Comet Shoemaker-Levy Collision with Jupiter. NASA. http://www2.jpl.nasa.gov/sl9/. Retrieved 2007-01-02.
- ↑ Robert R. Britt (23 August 2004). Remnants of 1994 Comet Impact Leave Puzzle at Jupiter. space.com. http://www.space.com/scienceastronomy/mystery_monday_040823.html. Retrieved 20 February 2007.
- ↑ Staff (21 July 2009). Amateur astronomer discovers Jupiter collision, In: ABC News online. http://www.abc.net.au/news/stories/2009/07/21/2632368.htm. Retrieved 21 July 2009.
- ↑ Mike Salway (19 July 2009). Breaking News: Possible Impact on Jupiter, Captured by Anthony Wesley, In: IceInSpace News. IceInSpace. http://www.iceinspace.com.au/index.php?id=70,550,0,0,1,0. Retrieved 19 July 2009.
- ↑ Grossman, Lisa (July 20, 2009). "Jupiter sports new 'bruise' from impact". New Scientist. http://www.newscientist.com/article/dn17491-jupiter-sports-new-bruise-from-impact.html.
- ↑ Michael Bakich (4 June 2010). Another impact on Jupiter. Astronomy Magazine online. http://www.astronomy.com/asy/default.aspx?c=a&id=9918. Retrieved 4 June 2010.
- ↑ Beatty Kelly (22 August 2010). Another Flash on Jupiter!. Sky Publishing. http://web.archive.org/web/20100827180208/http://www.skyandtelescope.com/community/skyblog/observingblog/101264994.html. Retrieved 23 August 2010. "Masayuki Tachikawa was observing ... 18:22 Universal Time on the 20th ... Kazuo Aoki posted an image ... Ishimaru of Toyama prefecture observed the event"
- ↑ George Hall (September 2012). George's Astrophotography. http://georgeastro.weebly.com/jupiter.html. Retrieved 17 September 2012. "10 Sept. 2012 11:35 UT .. observed by Dan Petersen"
- ↑ Nancy Atkinson (24 December 2015). How Jupiter is Getting Its Belt Back. Universe Today. http://www.universetoday.com/79931/how-jupiter-is-getting-its-belt-back/. Retrieved 12 February 2017.
- ↑ 15.0 15.1 15.2 15.3 Scott Bolton (30 May 2017). 'It's Snowing on Jupiter': Stunning Photos Show Clouds High in Gas Giant's Skies. Space.com. http://www.space.com/37009-jupiter-snow-high-clouds-juno-photos.html. Retrieved 4 June 2017.
X-rays


The "image of Jupiter [at right] shows concentrations of auroral X-rays near the north and south magnetic poles."[1] The Chandra X-ray Observatory accumulated X-ray counts from Jupiter for its entire 10-hour rotation on December 18, 2000. Note that X-rays from the entire globe of Jupiter are detected.
In the second at right is a diagram describing interaction with the local magnetic field. Jupiter's strong, rapidly rotating magnetic field (light blue lines in the figure) generates strong electric fields in the space around the planet. Charged particles (white dots), "trapped in Jupiter's magnetic field, are continually being accelerated (gold particles) down into the atmosphere above the polar regions, so auroras are almost always active on Jupiter. Electric voltages of about 10 million volts, and currents of 10 million amps - a hundred times greater than the most powerful lightning bolts - are required to explain the auroras at Jupiter's poles, which are a thousand times more powerful than those on Earth. On Earth, auroras are triggered by solar storms of energetic particles, which disturb Earth's magnetic field. As shown by the swept-back appearance in the illustration, gusts of particles from the Sun also distort Jupiter's magnetic field, and on occasion produce auroras."[2]
References
- ↑ NASA/CXC/SWRI/G.R.Gladstone (27 February 2002). Jupiter Hot Spot Makes Trouble For Theory. Cambridge, Massachusetts: Harvard-Smithsonian Center for Astrophysics. http://chandra.harvard.edu/photo/2002/0001/. Retrieved 11 July 2012.
- ↑ X-ray: NASA/CXC/MSFC/R.ElsnerExpression error: Unrecognized word "etal". (2 March 2005). Jupiter: Chandra Probes High-Voltage Auroras on Jupiter. Cambridge, Massachusetts: Harvard-Smithsonian Center for Astrophysics. http://chandra.harvard.edu/photo/2005/jupiter/. Retrieved 11 July 2012.
Ultraviolet astronomy


In astronomy, very hot objects preferentially emit UV radiation (see Wien's law). Because the ozone layer blocks many UV frequencies from reaching telescopes on the surface of the Earth, most UV observations are made from space.
At right is an ultraviolet image of aurora at Jupiter's north pole by the Hubble Space Telescope.
"Experiments on the Voyager 1 and 2 spacecraft and observations made by the International Ultraviolet Explorer (IUE) have provided evidence for the existence of energetic particle precipitation into the upper atmosphere of Jupiter from the magnetosphere."[1]
The image at lower right shows Jupiter's atmosphere at a wavelength of 2550 Angstroms after many impacts by fragments of comet Shoemaker-Levy 9. The most recent impactor is fragment R which is below the center of Jupiter (third dark spot from the right). This photo was taken 3:55 EDT on July 21, about 2.5 hours after R's impact. A large dark patch from the impact of fragment H is visible rising on the morning (left) side. Proceding to the right, other dark spots were caused by impacts of fragments Q1, R, D and G (now one large spot), and L, with L covering the largest area of any seen thus far. Small dark spots from B, N, and Q2 are visible with careful inspection of the image. The spots are very dark in the ultraviolet because a large quantity of dust is being deposited high in Jupiter's stratosphere, and the dust absorbs sunlight.
References
- ↑ T. E. Cravens (1987). "Vibrationally excited molecular hydrogen in the upper atmosphere of Jupiter". Journal of Geophysical Research 92 (A10): 11,083-100. doi:10.1029/JA092iA10p11083. http://www.agu.org/pubs/crossref/1987/JA092iA10p11083.shtml. Retrieved 2012-07-09.
Electrons
"Field-aligned equatorial electron beams [have been] observed within Jupiter’s middle magnetosphere. ... the Jupiter equatorial electron beams are spatially and/or temporally structured (down to <20 km at auroral altitudes, or less than several minutes), with regions of intense beams intermixed with regions absent of such beams."[1]
"Jovian electrons, both at Jupiter and in the interplanetary medium near Earth, have a very hard spectrum that varies as a power law with energy (see, e.g., Mewaldt et al. 1976). This spectral character is sufficiently distinct from the much softer solar and magnetospheric electron spectra that it has been used as a spectral filter to separate Jovian electrons from other sources ... A second Jovian electron characteristic is that such electrons in the interplanetary medium tend to consist of flux increases of several days duration which recur with 27 day periodicities ... A third feature of Jovian electrons at 1 AU is that the flux increases exhibit a long-term modulation of 13 months which is the synodic period of Jupiter as viewed from Earth".[2]
References
- ↑ Barry H. Mauk and Joachim Saur (October 26, 2007). "Equatorial electron beams and auroral structuring at Jupiter". Journal of Geophysical Research 112 (A10221): 20. doi:10.1029/2007JA012370. http://www.agu.org/journals/ja/ja0710/2007JA012370/figures.shtml. Retrieved 2012-06-02.
- ↑ C. T. Russell, D. N. Baker and J. A. Slavin (1 January 1988). Faith Vilas. ed. The Magnetosphere of Mercury, In: Mercury. Tucson, Arizona, United States of America: University of Arizona Press. pp. 514-61. ISBN 0816510857. Bibcode: 1988merc.book..514R. http://www-ssc.igpp.ucla.edu/personnel/russell/papers/magMercury.pdf. Retrieved 23 August 2012.
Infrareds


"Spectra from the Voyager I IRIS experiment confirm the existence of enhanced infrared emission near Jupiter's north magnetic pole in March 1979."[1] "Some species previously detected on Jupiter, including CH3D, C2H2, and C2H6, have been observed again near the pole. Newly discovered species, not previously observed on Jupiter, include C2H4, C3H4, and C6H6. All of these species except CH3D appear to have enhanced abundances at the north polar region with respect to midlatitudes."[1]
The image at third lower right is "of Jupiter taken in infrared light on the night of [August 17, 2008,] with the Multi-Conjugate Adaptive Optics Demonstrator (MAD) prototype instrument mounted on ESO's Very Large Telescope. This false color photo is the combination of a series of images taken over a time span of about 20 minutes, through three different filters (2, 2.14, and 2.16 microns). The image sharpening obtained is about 90 milli-arcseconds across the whole planetary disc, a real record on similar images taken from the ground. This corresponds to seeing details about 186 miles wide on the surface of the giant planet. The great red spot is not visible in this image as it was on the other side of the planet during the observations. The observations were done at infrared wavelengths where absorption due to hydrogen and methane is strong. This explains why the colors are different from how we usually see Jupiter in visible-light. This absorption means that light can be reflected back only from high-altitude hazes, and not from deeper clouds. These hazes lie in the very stable upper part of Jupiter's troposphere, where pressures are between 0.15 and 0.3 bar. Mixing is weak within this stable region, so tiny haze particles can survive for days to years, depending on their size and fall speed. Additionally, near the planet's poles, a higher stratospheric haze (light blue regions) is generated by interactions with particles trapped in Jupiter's intense magnetic field."[2]
The image at the top shows Jupiter in the near infrared. "Five spots -- one colored white, one blue, and three black are scattered across the upper half of the planet. Closer inspection by NASA's Hubble Space Telescope reveals that these spots are actually a rare alignment of three of Jupiter's largest moons -- Io, Ganymede, and Callisto -- across the planet's face. In this image, the telltale signatures of this alignment are the shadows [the three black circles] cast by the moons. Io's shadow is located just above center and to the left; Ganymede's on the planet's left edge; and Callisto's near the right edge. Only two of the moons, however, are visible in this image. Io is the white circle in the center of the image, and Ganymede is the blue circle at upper right. Callisto is out of the image and to the right. ... Jupiter appears in pastel colors in this photo because the observation was taken in near-infrared light. Astronomers combined images taken in three near-infrared wavelengths to make this color image. The photo shows sunlight reflected from Jupiter's clouds. In the near infrared, methane gas in Jupiter's atmosphere limits the penetration of sunlight, which causes clouds to appear in different colors depending on their altitude. Studying clouds in near-infrared light is very useful for scientists studying the layers of clouds that make up Jupiter's atmosphere. Yellow colors indicate high clouds; red colors lower clouds; and blue colors even lower clouds in Jupiter's atmosphere. The green color near the poles comes from a thin haze very high in the atmosphere. Ganymede's blue color comes from the absorption of water ice on its surface at longer wavelengths. Io's white color is from light reflected off bright sulfur compounds on the satellite's surface. ... In viewing this rare alignment, astronomers also tested a new imaging technique. To increase the sharpness of the near-infrared camera images, astronomers speeded up Hubble's tracking system so that Jupiter traveled through the telescope's field of view much faster than normal. This technique allowed scientists to take rapid-fire snapshots of the planet and its moons. They then combined the images into one single picture to show more details of the planet and its moons."[3]
On July 19, 2009, a new black spot about the size of Earth was discovered in Jupiter's southern hemisphere by an amateur astronomer. Thermal infrared analysis showed it was warm and spectroscopic methods detected ammonia. JPL scientists confirmed that another impact event on Jupiter had occurred, probably a small undiscovered comet or other icy body.[4][5][6]
"These images [at left] show the distribution of the organic molecule acetylene at the north and south poles of Jupiter, based on data obtained by NASA's Cassini spacecraft in early January 2001. It is the highest-resolution map of acetylene to date on Jupiter. The enhanced emission results both from the warmer temperatures in the auroral hot spots, and probably also from an enhanced abundance in these regions. The detection helps scientists understand the chemical interactions between sunlight and molecules in Jupiter's stratosphere."[7]
The second image down on the left shows Jupiter in an infrared band where the Great Red Spot (on the lower left) is almost unseen.
References
- ↑ 1.0 1.1 Sang J. Kim; John Caldwell; A.R. Rivolo; R. Wagener; Glenn S. Orton (November 1985). "Infrared polar brightening on Jupiter. III - Spectrometry from the Voyager 1 IRIS experiment". Icarus 64 (2): 233-48. doi:10.1016/0019-1035(85)90088-0. http://www.sciencedirect.com/science/article/pii/0019103585900880. Retrieved 2012-07-09.
- ↑ ESO/F. Marchis; M. Wong; E. Marchetti; P. Amico; S. Tordo (2 October 2008). Sharpening up Jupiter. ESO Santiago, Chile: ESO. http://www.eso.org/public/images/eso0833a/. Retrieved 11 July 2012.
- ↑ Phil Davis (3 May 2011). Triple Eclipse. National Aeronautics and Space Administration. http://solarsystem.nasa.gov/multimedia/display.cfm?Category=Planets&IM_ID=3083. Retrieved 20 July 2012.
- ↑ Mystery impact leaves Earth-sized mark on Jupiter. CNN. 21 July 2009. http://www.cnn.com/2009/TECH/space/07/21/jupiter.nasa.meteor.scar/index.html.
- ↑ Overbye, Dennis (22 July 2009). All Eyepieces on Jupiter After a Big Impact. New York Times. http://www.nytimes.com/2009/07/22/science/space/22jupiter.html?hpw.
- ↑ Amateur astronomer spots Earth-size scar on Jupiter, Guardian, July 21, 2009
- ↑ Sue Lavoie01 (31 December 2010). Acetylene at Jupiter's North and South Poles. Ministry of Space Exploration. http://minsex.blogspot.com/2010_12_01_archive.html. Retrieved 6 February 2013.
Microwaves
"We in essence created a three-dimensional picture of ammonia gas in Jupiter’s atmosphere, which reveals upward and downward motions within the turbulent atmosphere."[1]
"The radio map shows ammonia-rich gases rising into and forming the upper cloud layers: an ammonium hydrosulfide cloud at a temperature near 200 Kelvin (minus 100 degrees Fahrenheit) and an ammonia-ice cloud in the approximately 160 Kelvin cold air (minus 170 degrees Fahrenheit). These clouds are easily seen from Earth by optical telescopes."[2]
"Conversely, the radio maps show ammonia-poor air sinking into the planet, similar to how dry air descends from above the cloud layers on Earth."[2]
"The map also shows that hotspots – so-called because they appear bright in radio and thermal infrared images – are ammonia-poor regions that encircle the planet like a belt just north of the equator. Between these hotspots are ammonia-rich upwellings that bring ammonia from deeper in the planet."[2]
"With radio, we can peer through the clouds and see that those hotspots are interleaved with plumes of ammonia rising from deep in the planet, tracing the vertical undulations of an equatorial wave system."[3]
"We now see high ammonia levels like those detected by Galileo from over 100 kilometers deep, where the pressure is about eight times Earth’s atmospheric pressure, all the way up to the cloud condensation levels."[1]
"We now see fine structure in the 12 to 18 gigahertz band, much like we see in the visible, especially near the Great Red Spot, where we see a lot of little curly features. Those trace really complex upwelling and downwelling motions there."[3]
"Jupiter’s rotation once every 10 hours usually blurs radio maps, because these maps take many hours to observe. But we have developed a technique to prevent this and so avoid confusing together the upwelling and downwelling ammonia flows, which had led to the earlier underestimate."[4]
"The pink glow surrounding the planet [in the image on the right] is synchrotron radiation produced by spiraling electrons trapped in Jupiter’s magnetic field. Banded details on the planet’s disk probe depths of 30-90 km below the clouds. This image is averaged from 10 hours of VLA data, so the fine details seen in the other maps are smeared here by the planet’s rotation."[1]
References
- ↑ 1.0 1.1 1.2 Imke de Pater (2 June 2016). New radio map of Jupiter reveals what’s beneath colorful clouds. Berkeley, Calfornia USA: University of California, Berkeley. http://news.berkeley.edu/2016/06/02/new-radio-map-of-jupiter-reveals-whats-beneath-colorful-clouds/. Retrieved 18 August 2016.
- ↑ 2.0 2.1 2.2 Robert Sanders (2 June 2016). New radio map of Jupiter reveals what’s beneath colorful clouds. Berkeley, Calfornia USA: University of California, Berkeley. http://news.berkeley.edu/2016/06/02/new-radio-map-of-jupiter-reveals-whats-beneath-colorful-clouds/. Retrieved 18 August 2016.
- ↑ 3.0 3.1 Michael Wong (2 June 2016). New radio map of Jupiter reveals what’s beneath colorful clouds. Berkeley, Calfornia USA: University of California, Berkeley. http://news.berkeley.edu/2016/06/02/new-radio-map-of-jupiter-reveals-whats-beneath-colorful-clouds/. Retrieved 18 August 2016.
- ↑ Robert Sault (2 June 2016). New radio map of Jupiter reveals what’s beneath colorful clouds. Berkeley, Calfornia USA: University of California, Berkeley. http://news.berkeley.edu/2016/06/02/new-radio-map-of-jupiter-reveals-whats-beneath-colorful-clouds/. Retrieved 18 August 2016.
Radios
In 1955, Bernard Burke and Kenneth Franklin detected bursts of radio signals coming from Jupiter at 22.2 MHz.[1] The period of these bursts matched the rotation of the planet, and they were also able to use this information to refine the rotation rate. Radio bursts from Jupiter were found to come in two forms: long bursts (or L-bursts) lasting up to several seconds, and short bursts (or S-bursts) that had a duration of less than a hundredth of a second.[2]
Forms of decametric radio signals from Jupiter:
- bursts (with a wavelength of tens of meters) vary with the rotation of Jupiter, and are influenced by interaction of Io with Jupiter's magnetic field.[3]
- emission (with wavelengths measured in centimeters) was first observed by Frank Drake and Hein Hvatum in 1959.[1] The origin of this signal was from a torus-shaped belt around Jupiter's equator. This signal is caused by cyclotron radiation from electrons that are accelerated in Jupiter's magnetic field.[4]
Between September and November 23, 1963, Jupiter is detected by radar astronomy.[5]
"The dense atmosphere makes a penetration to a hard surface (if indeed one exists at all) very unlikely. In fact, the JPL results imply a correlation of the echo with Jupiter ... which corresponds to the upper (visible) atmosphere. ... Further observations will be needed to clarify the current uncertainties surrounding radar observations of Jupiter."[5]
"Although in 1963 some claimed to have detected echoes from Jupiter, these were quite weak and have not been verified by later experiments."[6]
"A search for radar echoes from Jupiter at 430 MHz during the oppositions of 1964 and 1965 failed to yield positive results, despite a sensitivity several orders of magnitude better than employed by other groups in earlier (1963) attempts at higher frequencies. ... [I]t might be suspected that meteorological disturbances of a random nature were involved, and that the echoes might be returned only in exceptional circumstances. Further support for this point of view may be gleaned from the fact that JPL found positive results for only 1 (centered at 32° System I longitude) of the 8 longitude regions investigated in 1963 (Goldstein 1964) and, in fact, had no success during their observations in 1964 (see comment by Goldstein following Dyce 1965)."[7]
"This VLA image of Jupiter [at right] doesn't look like a planetary disk at all. Most of the radio emission is synchrotron radiation from electrons in Jupiter's magnetic field."[8]
References
- ↑ 1.0 1.1 Linda T. Elkins-Tanton (2006). Jupiter and Saturn. New York: Chelsea House. ISBN 0-8160-5196-8.
- ↑ Weintraub, Rachel A. (26 September 2005). How One Night in a Field Changed Astronomy. NASA. http://www.nasa.gov/vision/universe/solarsystem/radio_jupiter.html. Retrieved 18 February 2007.
- ↑ Garcia, Leonard N. The Jovian Decametric Radio Emission. NASA. http://radiojove.gsfc.nasa.gov/library/sci_briefs/decametric.htm. Retrieved 18 February 2007.
- ↑ Klein, M. J.; Gulkis, S.; Bolton, S. J. (1996). Jupiter's Synchrotron Radiation: Observed Variations Before, During and After the Impacts of Comet SL9. NASA. http://deepspace.jpl.nasa.gov/technology/TMOT_News/AUG97/jupsrado.html. Retrieved 18 February 2007.
- ↑ 5.0 5.1 Gordon H. Pettengill & Irwin I. Shapiro (1965). "Radar Astronomy". Annual Review of Astronomy and Astrophysics 3: 377-410.
- ↑ Irwin I. Shapiro (March 1968). "Planetary radar astronomy". Spectrum, IEEE 5 (3): 70-9. doi:10.1109/MSPEC.1968.5214821. http://ieeexplore.ieee.org/xpls/abs_all.jsp?arnumber=5214821. Retrieved 2012-12-25.
- ↑ R. B. Dyce and G. H. Pettengill, and A. D. Sanchez (August 1967). "Radar Observations of Mars and Jupiter at 70 cm". The Astronomical Journal 72 (4): 771-7. doi:10.1086/110307. http://articles.adsabs.harvard.edu/cgi-bin/nph-iarticle_query?1967AJ.....72..771D&data_type=PDF_HIGH&whole_paper=YES&type=PRINTER&filetype=.pdf. Retrieved 2012-12-25.
- ↑ S.G. Djorgovski (16 March 2016). A Tour of the Radio Universe. National Radio Astronomy Observatory. http://www.cv.nrao.edu/course/astr534/Tour.html. Retrieved 16 March 2014.
Cosmic rays

Jupiter's strong, rapidly rotating magnetic field (light blue lines in the figure) generates strong electric fields in the space around the planet. Charged particles (white dots), "trapped in Jupiter's magnetic field, are continually being accelerated (gold particles) down into the atmosphere above the polar regions, so auroras are almost always active on Jupiter. Electric voltages of about 10 million volts, and currents of 10 million amps - a hundred times greater than the most powerful lightning bolts - are required to explain the auroras at Jupiter's poles, which are a thousand times more powerful than those on Earth. On Earth, auroras are triggered by solar storms of energetic particles, which disturb Earth's magnetic field. As shown by the swept-back appearance in the illustration, gusts of particles from the Sun also distort Jupiter's magnetic field, and on occasion produce auroras."[1]
"The helium vector magnetometer [in the image on the left] measures the fine structure of the interplanetary field, maps the Jovian field, and provides field measurements to evaluate solar wind interaction with Jupiter. The magnetometer operates in any one of eight different ranges, the lowest of which covers magnetic fields from ±0.01 to ±4.0 gamma; the highest fields up to ±140,000 gamma; i.e., ±1.4 Gauss."[2]
References
- ↑ X-ray: NASA/CXC/MSFC/R.ElsnerExpression error: Unrecognized word "etal". (2 March 2005). Jupiter: Chandra Probes High-Voltage Auroras on Jupiter. Cambridge, Massachusetts: Harvard-Smithsonian Center for Astrophysics. http://chandra.harvard.edu/photo/2005/jupiter/. Retrieved 11 July 2012.
- ↑ Edward J. Smith (6 August 2004). Magnetic Fields. Washington, DC USA: NASA. http://history.nasa.gov/SP-349/ch4.htm. Retrieved 17 August 2016.
Blues

The wide equatorial zone is visible in the center surrounded by two dark equatorial belts (SEB and NEB).
"The large grayish-blue [irregular] "hot spots" at the northern edge of the white Equatorial Zone change over the course of time as they march eastward across the planet."[1]
"The Great Red Spot shows its counterclockwise rotation, and the uneven distribution of its high haze is obvious. To the east (right) of the Red Spot, oval storms, like ball bearings, roll over and pass each other. Horizontal bands adjacent to each other move at different rates. Strings of small storms rotate around northern-hemisphere ovals."[1]
"Small, very bright features appear quickly and randomly in turbulent regions, candidates for lightning storms."[1]
"The smallest visible features at the equator are about 600 kilometers (about 370 miles) across."[1]
"The clip consists of 14 unevenly spaced timesteps, each a true color cylindrical projection of the complete circumference of Jupiter, from 60 degrees south to 60 degrees north. The maps are made by first assembling mosaics of six images taken by Cassini's narrow-angle camera in the same spectral filter over the course of one Jupiter rotation and, consequently, covering the whole planet. Three such global maps -- in red, green and blue filters -- are combined to make one color map showing Jupiter during one Jovian rotation. Fourteen such maps, spanning 24 Jovian rotations at uneven time intervals comprise the movie."[1]
The passage of time is accelerated by a factor of 600,000.
References
- ↑ 1.0 1.1 1.2 1.3 1.4 Sue Lavoie (28 December 2000). PIA02863: Planetwide Color Movie. Tucson, Arizona USA: NASA/JPL/University of Arizona. http://photojournal.jpl.nasa.gov/catalog/PIA02863. Retrieved 30 May 2013.
Oranges
In the image at the top of the page, orange cloud bands are clearly visible on Jupiter.
"[O]range [is] the color of Jupiter"[1].
The orange and brown coloration in the clouds of Jupiter are caused by upwelling compounds that change color when they are exposed to ultraviolet light from the Sun. The exact makeup remains uncertain, but the substances are believed to be phosphorus, sulfur or possibly hydrocarbons.[2][3] These colorful compounds, known as chromophores, mix with the warmer, lower deck of clouds. The zones are formed when rising convection cells form crystallizing ammonia that masks out these lower clouds from view.[4]
"This image [on the right] of Jupiter is a composite of three color images taken on Nov. 16, 2010, by NASA's Infrared Telescope Facility. The particles lofted by the initial outbreak are easily identified in green as high altitude particles at the upper right, with a second outbreak to the lower left."[5]
"Earlier this year, one of Jupiter’s stripes went missing. The Southern Equatorial Band started to get lighter and paler, and eventually disappeared. Now, follow-up images from both professional and amateur astronomers are showing some activity in the area of the SEB, and scientists now believe the vanished dark stripe is making a comeback."[5]
“The reason Jupiter seemed to ‘lose’ this band – camouflaging itself among the surrounding white bands – is that the usual downwelling winds that are dry and keep the region clear of clouds died down. One of the things we were looking for in the infrared was evidence that the darker material emerging to the west of the bright spot was actually the start of clearing in the cloud deck, and that is precisely what we saw.”[6]
"This white cloud deck is made up of white ammonia ice. When the white clouds float at a higher altitude, they obscure the missing brown material, which floats at a lower altitude. Every few decades or so, the South Equatorial Belt turns completely white for perhaps one to three years, an event that has puzzled scientists for decades. This extreme change in appearance has only been seen with the South Equatorial Belt, making it unique to Jupiter and the entire solar system."[5]
"The white band wasn’t the only change on the big, gaseous planet. At the same time, Jupiter’s Great Red Spot became a darker red color."[5]
"The color of the spot – a giant storm on Jupiter that is three times the size of Earth and a century or more old – will likely brighten a bit again as the South Equatorial Belt makes its comeback."[6]
"The South Equatorial Belt underwent a slight brightening, known as a “fade,” just as NASA’s New Horizons spacecraft was flying by on its way to Pluto in 2007. Then there was a rapid “revival” of its usual dark color three to four months later. The last full fade and revival was a double-header event, starting with a fade in 1989, revival in 1990, then another fade and revival in 1993. Similar fades and revivals have been captured visually and photographically back to the early 20th century, and they are likely to be a long-term phenomenon in Jupiter’s atmosphere."[5]
References
- ↑ Faber Birren (Summer 1983). "Color and human response". Color Research and Application 8 (2): 75-81. doi:10.1002/col.5080080204. http://onlinelibrary.wiley.com/doi/10.1002/col.5080080204/abstract. Retrieved 2012-04-23.
- ↑ Elkins-Tanton, Linda T. (2006). Jupiter and Saturn. New York: Chelsea House. ISBN 0-8160-5196-8.
- ↑ Strycker, P. D.; Chanover, N.; Sussman, M.; Simon-Miller, A. (2006). A Spectroscopic Search for Jupiter's Chromophores. American Astronomical Society. Bibcode: 2006DPS....38.1115S.
- ↑ Gierasch, Peter J.; Nicholson, Philip D. (2004). Jupiter. World Book @ NASA. http://www.nasa.gov/worldbook/jupiter_worldbook.html. Retrieved 10 August 2006.
- ↑ 5.0 5.1 5.2 5.3 5.4 Nancy Atkinson (24 December 2015). How Jupiter is Getting Its Belt Back. Universe Today. http://www.universetoday.com/79931/how-jupiter-is-getting-its-belt-back/. Retrieved 12 February 2017.
- ↑ 6.0 6.1 Glenn Orton (24 December 2015). How Jupiter is Getting Its Belt Back. Universe Today. http://www.universetoday.com/79931/how-jupiter-is-getting-its-belt-back/. Retrieved 12 February 2017.
Yellows

Submillimeters
The map at right "shows the distribution of water in the stratosphere of Jupiter as measured with the Herschel space observatory. White and cyan indicate highest concentration of water, and blue indicates lesser amounts. The map has been superimposed over an image of Jupiter taken at visible wavelengths with the NASA/ESA Hubble Space Telescope."[1]
"The distribution of water clearly shows an asymmetric distribution across the planet: water is more abundant in the southern hemisphere. Based on this and other clues collected with Herschel, astronomers have established that at least 95 percent of the water currently present in Jupiter's stratosphere was supplied by comet Shoemaker-Levy 9, which famously impacted the planet at intermediate southern latitudes in 1994."[1]
"The map is based on spectrometric data collected with the Photodetecting Array Camera and Spectrometer (PACS) instrument on board Herschel around 66.4 microns, a wavelength that corresponds to one of water's many spectral signatures."[1]
References
- ↑ 1.0 1.1 1.2 T. Cavali (23 April 2013). Distribution of Water in Jupiter's Stratosphere. ESA/Herschel/NASA. http://www.herschel.caltech.edu/image/nhsc2013-014a. Retrieved 12 March 2014.
Visuals

"In what's beginning to look like a case of planetary measles, a third red spot has appeared alongside its cousins - the Great Red Spot and Red Spot Jr. - in the turbulent Jovian atmosphere. This third red spot, which is a fraction of the size of the two other features, lies to the west of the Great Red Spot in the same latitude band of clouds. The visible-light images were taken on May 9 and 10 with Hubble's Wide Field and Planetary Camera 2."[1]
References
- ↑ M. Wong and I. de Pater (22 May 2008). New Red Spot Appears on Jupiter. Baltimore, Maryland USA: Hubble Site. http://hubblesite.org/news_release/news/2008-23. Retrieved 18 June 2018.
Opticals
.jpg)
.jpg)
"This Hubble picture [on the left], taken on July 23, is the first full-disk natural-color image of Jupiter made with Hubble's new camera, the Wide Field Camera 3 (WFC3). It is the sharpest visible-light picture of Jupiter since the New Horizons spacecraft flew by that planet in 2007. Each pixel in this high-resolution image spans about 74 miles (119 km) in Jupiter's atmosphere. Jupiter was more than 370 million miles (600 million km) from Earth when the images were taken."[1]
"The dark smudge at bottom right is debris from a comet or asteroid that plunged into Jupiter's atmosphere and disintegrated."[1]
"In addition to the fresh impact, the image reveals a spectacular variety of shapes in the swirling atmosphere of Jupiter. The planet is wrapped in bands of yellow, brown, and white clouds. These bands are produced by the atmosphere flowing in different directions at various latitudes. When these opposing flows interact, turbulence appears."[1]
"Such data complement the images taken from other telescopes and spacecraft by providing exquisite details of atmospheric phenomena. For example, the image suggests that dark "barges" – tracked by amateur astronomers on a nightly basis – may differ both in form and color from barge features identified by the Voyager spacecraft. (The Great Red Spot and the smaller Red Oval are both out of view on the other side of the planet.)"[1]
"This color image is a composite of three separate color exposures (red, blue, and green) made by WFC3. Additional processing was done to compensate for asynchronous imaging in the color filters and other effects."[1]
"A Hubble picture [on the right in ultraviolet and visible lighy] from June 7, 2010, reveals a slightly higher altitude layer of white ammonia ice crystal clouds that appears to obscure the deeper, darker belt clouds of the SEB. The team predicts that these clouds should clear out in a few months."[2]
"Hubble also resolved a string of dark spots farther south of the vanished belt. Based on past observations, the Hubble Jupiter team expects to see similar spots appear in the SEB, right before its white clouds clear out in a few months."[2]
"The giant stormy planet Jupiter has gone through a makeover, as seen in the image below, taken nearly 11 months earlier. Several months ago the dark Southern Equatorial Belt (SEB) vanished. The last time this happened was in the early 1970s, when we didn't have powerful enough telescopes to study the change in detail."[2]
"This natural color planet portrait was taken in visible light with Hubble's new Wide Field Camera 3."[2]
References
- ↑ 1.0 1.1 1.2 1.3 1.4 M. Wong; H. B. Hammel; the Jupiter Impact Team (23 July 2009). Collision Leaves Giant Jupiter Bruised. Baltimore, Maryland USA: Space Telescope Science Institute. http://hubblesite.org/image/2573/news_release/2009-25. Retrieved 18 June 2018.
- ↑ 2.0 2.1 2.2 2.3 M.H. Wong; H.B. Hammel; A.A. Simon-Miller; the Jupiter Impact Science Team (7 June 2010). HST WFC3 Jupiter Image (June 7, 2010). Berkeley, California USA: University of Califoria. http://hubblesite.org/image/2745/news_release/2010-20. Retrieved 18 June 2018.
Visuals

There is anecdotal evidence that people had seen the Galilean moons of Jupiter before telescopes were invented.[1]
References
- ↑ Zezong, Xi, "The Discovery of Jupiter's Satellite Made by Gan De 2000 years Before Galileo", Chinese Physics 2 (3) (1982): 664–67.
Violets

.jpg)
"This movie [at right] records an eruptive event in the southern hemisphere of Jupiter over a period of 8 Jupiter days. Prior to the event, an undistinguished oval cloud mass cruised through the turbulent atmosphere. The eruption occurs over a very short time at the very center of the cloud. The white eruptive material is swirled about by the internal wind patterns of the cloud. As a result of the eruption, the cloud then becomes a type of feature seen elsewhere on Jupiter known as "spaghetti bowls.""[1]
"As Voyager 2 approached Jupiter in 1979, it took images of the planet at regular intervals. This sequence is made from 8 images taken once every Jupiter rotation period (about 10 hours). These images were acquired in the Violet filter around May 6, 1979. The spacecraft was about 50 million kilometers from Jupiter at that time."[1]
At left is a "Voyager 1 image showing Jupiter with its satellite Io visible at lower left. Jupiter is 140,000 km in diameter and Io is 3600 km across. This image was taken with the narrow angle camera using the violet filter from a distance of 25 million km on 9 February 1979. North is at about 11:00 (Voyager 1, 15672.37)".[2]
"These images [at lower right] show the apparent edge (limb) of the planet Jupiter as seen through both the violet filter (top frame) and an infrared filter (756 nanometers, bottom frame) of the Solid State Imaging (CCD) system aboard NASA's Galileo spacecraft. North is to the top of the picture. A separate haze layer is clearly visible above the northern part of the limb."[3]
"This haze layer becomes less well defined to the south (bottom left). Such a detached haze layer has been seen previously on only one other body with a thick atmosphere: Saturn's satellite Titan. The haze layer cannot be lower in the atmosphere than a pressure of about 10 millibars (mbar), or about 40 kilometers (km) above the tropopause. (The tropopause, where the temperature stops decreasing with height, is at about 100 mbar, 20 km above the tops of the ammonia clouds.) There is some indication of streaks of slightly brighter and darker material running roughly north-south (parallel to the limb) on Jupiter's crescent."[3]
"The images, which show the limb between 60.5 degrees and 61.8 degrees North latitude (planetographic) and near 315 degrees West longitude, were obtained on December 20, 1996 Universal Time. The spacecraft was about 1,286,000 km (18.0 Jovian radii) from the limb of Jupiter and the resolution is about 13 kilometers per picture element."[3]
References
- ↑ 1.0 1.1 Image Processing Laboratory (6 April 2000). PIA02257: Voyager 2 Jupiter Eruption Movie. Pasadena, California USA: NASA/JPL. http://photojournal.jpl.nasa.gov/catalog/PIA02257. Retrieved 22 March 2013.
- ↑ Voyager 1 team (9 February 1979). Jupiter, Io - Voyager 1. Greenbelt, Maryland USA: NASA Goddard Space Flight Center. http://nssdc.gsfc.nasa.gov/imgcat/html/object_page/vg1_1567237.html. Retrieved 22 March 2013.
- ↑ 3.0 3.1 3.2 Sue Lavoie (6 March 1998). PIA01195: Hazes near Jupiter's Limb (60 degrees North, 315 degrees West). Pasadena, California USA: NASA/JPL. http://photojournal.jpl.nasa.gov/catalog/pia01195. Retrieved 1 April 2013.
Reds

"On April 3, 2017, as Jupiter made its nearest approach to Earth in a year, NASA's Hubble Space Telescope viewed the solar system's largest planet in all of its up-close glory. At a distance of 415 million miles (668 million kilometers) from Earth, Jupiter offered spectacular views of its colorful, roiling atmosphere, the legendary Great Red Spot, and its smaller companion at farther southern latitudes dubbed "Red Spot Jr.""[1]
"The giant planet is now at "opposition," positioned directly opposite the sun from the Earth. This means that the sun, Earth, and Jupiter line up, with Earth sitting between the sun and the gas giant. Opposition also marks Jupiter's closest point to us, and the planet appears brighter in the night sky than at any other time in the year."[1]
"This positioning allowed a team led by Amy Simon of NASA's Goddard Space Flight Center in Greenbelt, Maryland to observe Jupiter using Hubble's Wide Field Camera 3. Hubble photographed exquisite details in Jupiter's atmosphere, as small as about 80 miles (129 kilometers) across."[1]
"With its immense and powerful storms and hundreds of smaller vortices, the atmosphere of Jupiter is divided into several distinct, colorful bands, parallel to the equator. These bands, with alternating wind motions, are created by differences in the thickness and height of the ammonia ice clouds; the lighter bands rise higher and have thicker clouds than the darker bands. The bands are separated by winds that can reach speeds of up to 400 miles (644 kilometers) per hour."[1]
"Jupiter is best known for the Great Red Spot, an anticyclone that has raged for at least 150 years. This famous storm is larger than Earth. However, the Great Red Spot is slowly shrinking-a trend seen since the late 1800s. The reason for this phenomenon is still unknown. Hubble will continue to observe Jupiter in hopes of solving this riddle."[1]
"The images are part of the Outer Planets Atmospheres Legacy program or OPAL. This program provides yearly Hubble global views of the outer planets to look for changes in their storms, winds, and clouds. It began in 2014 with Uranus, and has been studying Jupiter and Neptune since 2015. In 2018, it will begin viewing Saturn."[1]
"The team timed the Hubble observation to coincide with when NASA's space probe Juno would be near its closest point to Jupiter, so that scientists could get concurrent observations."[1]
References
- ↑ 1.0 1.1 1.2 1.3 1.4 1.5 1.6 Amy Simon (3 April 2017). NASA's Hubble Takes Close-up Portrait of Jupiter. Greenbelt, Maryland USA: Goddard Space Flight Center. http://hubblesite.org/image/4012/category/1-planets. Retrieved 18 June 2018.
Blues

Reds
The Great Red Spot (GRS) is a persistent anticyclonic storm, 22° south of Jupiter's equator, which has lasted for at least 194 years and possibly longer than 359 years.[1][2] The storm is large enough to be visible through Draft:Earth-based telescopes. Its dimensions are 24–40,000 km west–to–east and 12–14,000 km south–to–north. The spot is large enough to contain two or three planets the size of Earth. At the start of 2004, the Great Red Spot had approximately half the longitudinal extent it had a century ago, when it was 40,000 km in diameter. The Great Red Spot's latitude has been stable for the duration of good observational records, typically varying by about a degree.
It is not known exactly what causes the Great Red Spot's reddish color. Theories supported by laboratory experiments suppose that the color may be caused by complex organic molecules, red phosphorus, or yet another sulfur compound. The Great Red Spot (GRS) varies greatly in hue, from almost brick-red to pale salmon, or even white. The reddest central region is slightly warmer than the surroundings, which is the first evidence that the Spot's color is affected by environmental factors.[3] The spot occasionally disappears from the visible spectrum, becoming evident only through the Red Spot Hollow, which is its niche in the South Equatorial Belt. The visibility of GRS is apparently coupled to the appearance of the SEB; when the belt is bright white, the spot tends to be dark, and when it is dark, the spot is usually light. The periods when the spot is dark or light occur at irregular intervals; as of 1997, during the preceding 50 years, the spot was darkest in the periods 1961–66, 1968–75, 1989–90, and 1992–93.[4]
"Jupiter’s most celebrated atmospheric beauty mark, the Great Red Spot (GRS), has been shrinking for years. When I was a kid in the ’60s peering through my Edmund 6-inch reflector, not only was the Spot decidedly red, but it was extremely easy to see. Back then it really did span three Earths."[5]
"In the 1880s the GRS resembled a huge blimp gliding high above white crystalline clouds of ammonia and spanned 40,000 km (25, 000 miles) across. You couldn’t miss it even in those small brass refractors that were the standard amateur observing gear back in the day. Nearly one hundred years later in 1979, the Spot’s north-south extent has remained virtually unchanged, but it’s girth had shrunk to 25,000 km (15,535 miles) or just shy of two Earth diameters. Recent work done by expert astrophotographer Damian Peach using the WINJUPOS program to precisely measure the GRS in high resolution photos over the past 10 years indicates a continued steady shrinkage:"[5] 2003 Feb – 18,420km (11,445 miles) 2005 Apr – 18,000km (11,184) 2010 Sep – 17,624km (10,951) 2013 Jan – 16,954km (10,534) 2013 Sep – 15,894km (9,876) 2013 Dec – 15,302km (9,508) = 1.2 Earth diameters.
"Not only has the Spot been shrinking, its rotation period has been speeding up. Older references give the period of one rotation at 6 days. John Rogers (British Astronomical Assn.) published a 2012 paper on the evolution of the GRS and discovered that between 2006 to 2012 – the same time as the Spot has been steadily shrinking – its rotation period has spun up to 4 days."[5]
"Rogers also estimated a max wind speed of 300 mph, up from about 250 mph in 2006. Despite its smaller girth, this Jovian hurricane’s winds pack more punch than ever. Even more fascinating, the Great Red Spot may have even disappeared altogether from 1713 to 1830 before reappearing in 1831 as a long, pale “hollow”. According to Rogers, no observations or sketches of that era mention it. Surely something so prominent wouldn’t be missed. This begs the question of what happened in 1831. Was the “hollow” the genesis of a brand new Red Spot unrelated to the one first seen by astronomer Giovanni Cassini in 1665? Or was it the resurgence of Cassini’s Spot?"[5]
References
- ↑ Staff (2007). Jupiter Data Sheet – SPACE.com. Imaginova. http://www.space.com/scienceastronomy/solarsystem/jupiter-ez.html. Retrieved 3 June 2008.
- ↑ Anonymous (10 August 2000). The Solar System – The Planet Jupiter – The Great Red Spot. Dept. Physics & Astronomy – University of Tennessee. http://csep10.phys.utk.edu/astr161/lect/jupiter/redspot.html. Retrieved 3 June 2008.
- ↑ Fletcher, Leigh N.; Orton,, G.S.; Mousis et. al, O.; Yanamandra-Fisher, P.; Parrish, P.D.; Irwin, P.G.J.; Fisher, B.M.; Vanzi, L. et al. (2010). "Thermal structure and composition of Jupiter's Great Red Spot from high-resolution thermal imaging" (PDF). Icarus 208 (1): 306–328. doi:10.1016/j.icarus.2010.01.005. http://www.eso.org/public/archives/releases/sciencepapers/eso1010/eso1010.pdf.
- ↑ Beebe, R. (1997). Jupiter the Giant Planet (2nd ed.). Washington: Smithsonian Books. ISBN 1-56098-685-9. OCLC 224014042.
- ↑ 5.0 5.1 5.2 5.3 Bob King (23 December 2015). Will Jupiter’s Great Red Spot Turn into a Wee Red Dot?. Universe Today. http://www.universetoday.com/108257/will-jupiters-great-red-spot-turn-into-a-wee-red-dot/. Retrieved 12 February 2017.
Meteors
"Scientists using NASA's Hubble Space Telescope have produced new global maps of Jupiter – the first in a series of annual portraits of the solar system's outer planets from the Outer Planet Atmospheres Legacy program (OPAL). The two Jupiter maps, representing nearly back-to-back rotations of the planet on Jan. 19, 2015, show the movements of the clouds and make it possible to determine the speeds of Jupiter's winds. The Hubble observations confirm that the Great Red Spot continues to shrink and become more circular. In addition, an unusual wispy filament is seen, spanning almost the entire width of the vortex. These findings are described in a new paper published online in the October 10 issue of The Astrophysical Journal."[1]
References
- ↑ Amy Simon (19 January 2015). Hubble's Planetary Portrait Captures New Changes in Jupiter's Great Red Spot. Baltimore, Maryland USA: Hubblesite. http://hubblesite.org/news_release/news/2015-37. Retrieved 19 June 2018.