University of Florida/Eml4507/s13.team4ever.Wulterkens.R6.5
Appearance
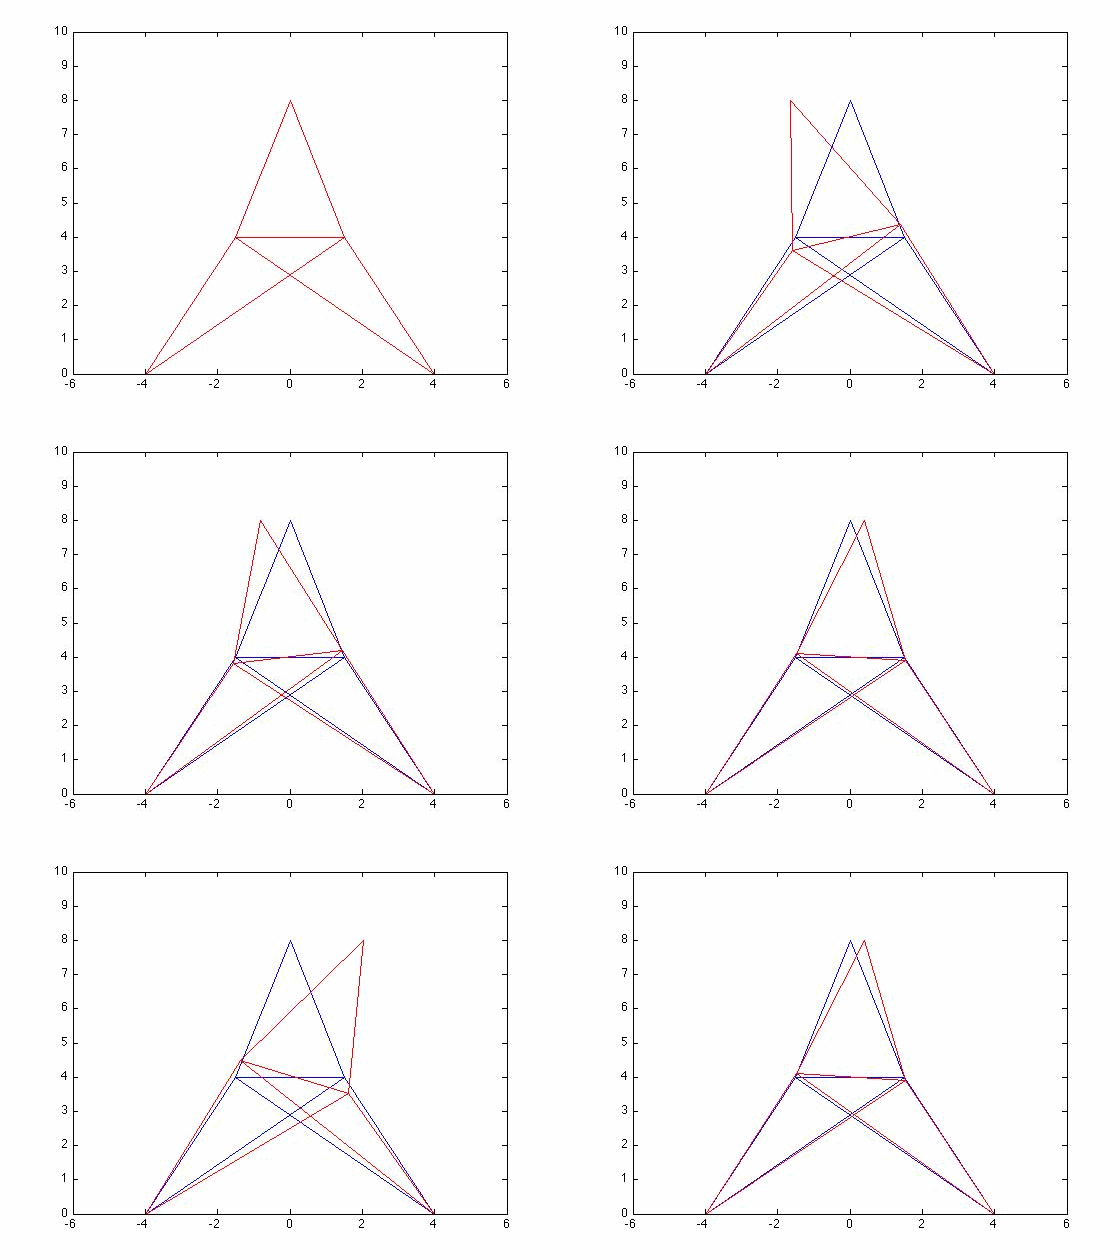
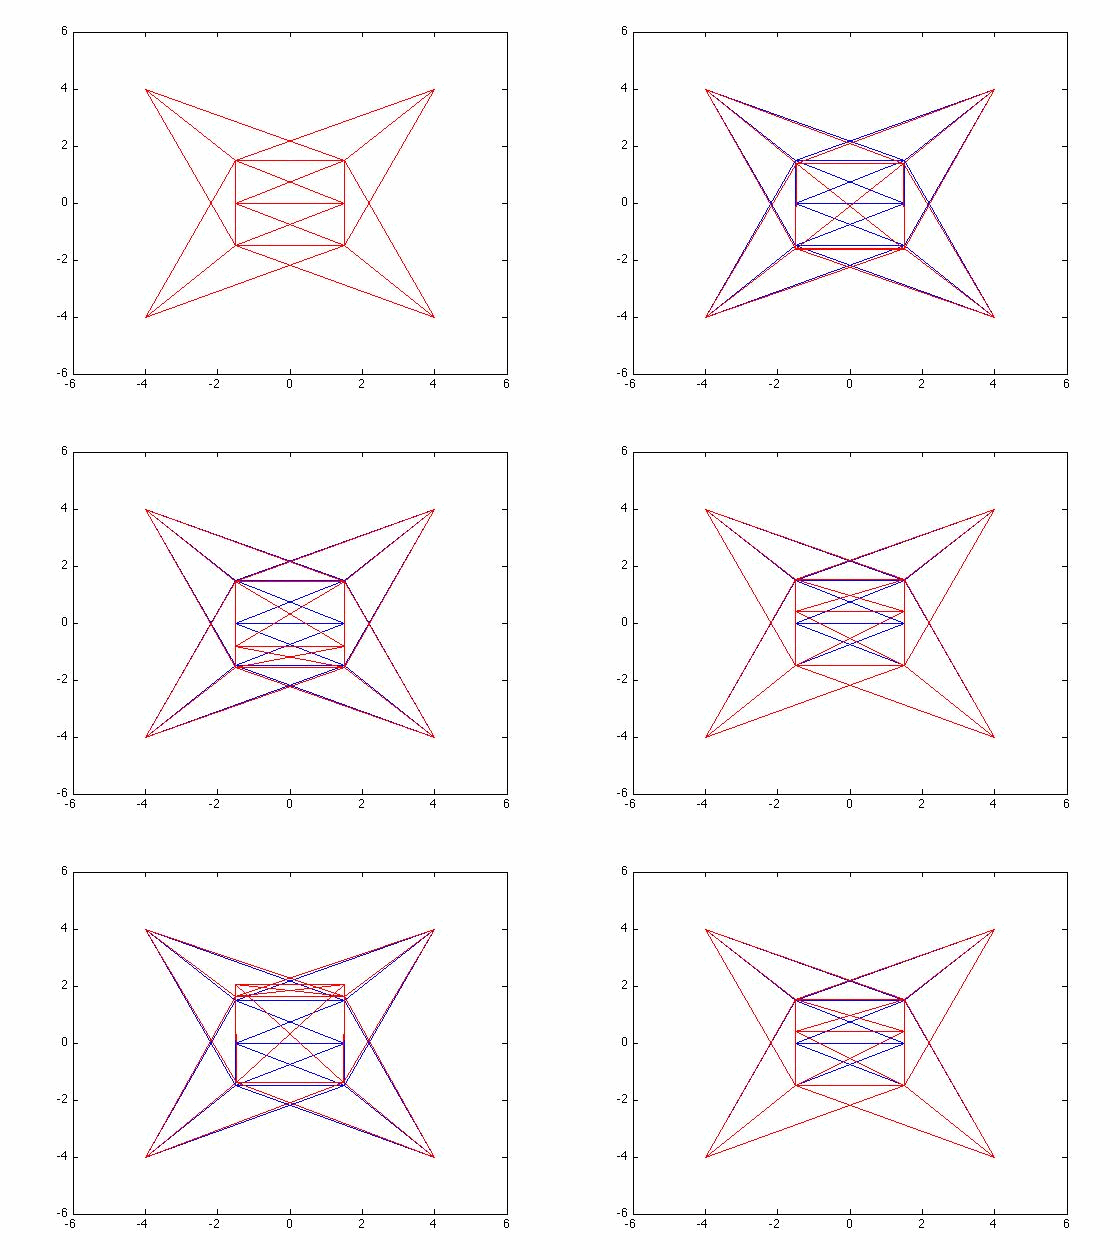
Problem 6.5 3d Mode Shapes
On my honor, I have neither given nor received unauthorized aid in doing this assignment.
Problem Statement
[edit | edit source]Determine the first 3 mode shapes of the 3D truss system from problem 6.4
Solution
[edit | edit source]The set up of the problem was the same as problem 6.4. The eigenvalues can be seen below.
Matlab code
[edit | edit source]%Makes an alternate K and M matrix to calncel rows and columns for boundary
%conditions.
Kr = K;
Mr = M;
Kr((19:30),:) = [];
Kr(:,(19:30)) = [];
Mr((19:30),:) = [];
Mr(:,(19:30)) = [];
%Find Eigenvalue and Eigenvector
[Vec Val] = eig(Kr,Mr);
Vec1 = zeros(18,1);
Vec2 = zeros(18,1);
Vec3 = zeros(18,1);
for i = 1:18
Vec1(i) = Vec(i,1);
Vec2(i) = Vec(i,2);
Vec3(i) = Vec(i,3);
end
%Insert back in the values for initial conditions.
Vec1 = [Vec1;zeros(12,1)];
Vec2 = [Vec2;zeros(12,1)];
Vec3 = [Vec3;zeros(12,1)];
%Add the Eigenvectors to the nodes
X1 = zeros(10,1);
Y1 = zeros(10,1);
Z1 = zeros(10,1);
X2 = zeros(10,1);
Y2 = zeros(10,1);
Z2 = zeros(10,1);
X3 = zeros(10,1);
Y3 = zeros(10,1);
Z3 = zeros(10,1);
X = zeros(10,1);
Y = zeros(10,1);
Z = zeros(10,1);
for i = 1:10
X1(i) = Vec1((i*3)-2,1);
Y1(i) = Vec1((i*3)-1,1);
Z1(i) = Vec1((i*3),1);
X(i) = pos(1,i);
Y(i) = pos(2,i);
Z(i) = pos(3,i);
X2(i) = Vec2((i*3)-2,1);
Y2(i) = Vec2((i*3)-1,1);
Z2(i) = Vec2((i*3),1);
X3(i) = Vec3((i*3)-2,1);
Y3(i) = Vec3((i*3)-1,1);
Z3(i) = Vec3((i*3),1);
end
X1 = X+X1;
Y1 = Y+Y1;
Z1 = Z+Z1;
X2 = X+X2;
Y2 = Y+Y2;
Z2 = Z+Z2;
X3 = X+X3;
Y3 = Y+Y3;
Z3 = Z+Z3;
Code used to plot the graphs
[edit | edit source]%plot origional shape
for i = 1:25
xc = [X(conn(1,i)),X(conn(2,i))];
yc = [Y(conn(1,i)),Y(conn(2,i))];
%zc = [Z(conn(1,i)),Z(conn(2,i))];
plot(xc,yc)
axis([-6 6 -6 6])
hold on
end
%plot mode 1
for i = 1:25
xc = [X1(conn(1,i)),X1(conn(2,i))];
yc = [Y1(conn(1,i)),Y1(conn(2,i))];
%zc = [Z1(conn(1,i)),Z1(conn(2,i))];
plot(xc,yc,'r')
hold on
end
%plot mode 2
for i = 1:25
xc = [X2(conn(1,i)),X2(conn(2,i))];
yc = [Y2(conn(1,i)),Y2(conn(2,i))];
zc = [Z2(conn(1,i)),Z2(conn(2,i))];
plot(xc,yc,'r')
hold on
end
%plot mode 3
for i = 1:25
xc = [X3(conn(1,i)),X3(conn(2,i))];
yc = [Y3(conn(1,i)),Y3(conn(2,i))];
%zc = [Z3(conn(1,i)),Z3(conn(2,i))];
plot(xc,yc,'r')
hold on
end


