Survey research and design in psychology/Tutorials/Correlation/Correlations and non-linear relations
Jump to navigation
Jump to search
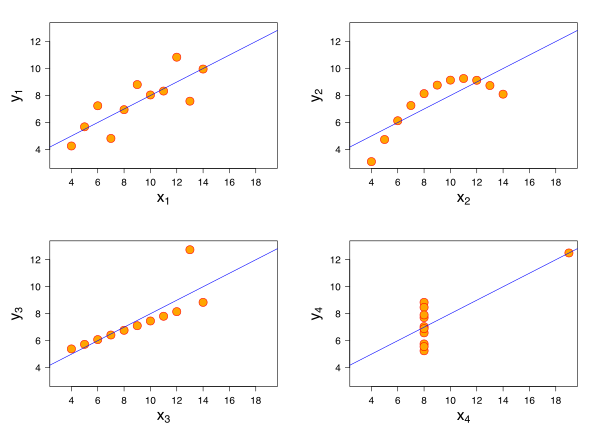
Four sets of data with the same correlation of 0.816 
Correlations and non-linear relations
The purpose of this exercise is to emphasise the importance of visualising bivariate relationships to check whether a linear correlation best represents the patterns in the data.
* Correlations between 4 pairs of variables.
CORRELATIONS /VARIABLES = x1 y1.
CORRELATIONS /VARIABLES = x1 y2.
CORRELATIONS /VARIABLES = x1 y3.
CORRELATIONS /VARIABLES = x2 y4.

* Scatterplots between 4 pairs of variables.
GRAPH /SCATTERPLOT(BIVAR)=x1 WITH y1.
GRAPH /SCATTERPLOT(BIVAR)=x1 WITH y2.
GRAPH /SCATTERPLOT(BIVAR)=x1 WITH y3.
GRAPH /SCATTERPLOT(BIVAR)=x2 WITH y4.
What do the linear correlations and bivariate scatterplots indicate about the relationship between the following pairs?
|
