
Observational astronomy/Variable stars
Activities
[edit | edit source]Algol
[edit | edit source]
Algol (also known as Beta Persei) is a bright star in the constellation Perseus.
Algol is not a single star; it is a triple-star system (Algol A, B, and C) in which the large and bright primary Algol A is regularly eclipsed by the dimmer Algol B every 2.87 days. The eclipsing binary pair is separated by only 0.062 astronomical units (AU) from each other, so close in fact that Algol A is slowly consuming the less massive Algol B by continually stripping off Algol B's outer layers. For comparison, Mercury is 0.4 AU from the Sun.
These eclipses can be predicted using the Variable Star Planner. Go to the Planner and click on the button for Algol and then click Initialize to today.
This will calculate the next times that the eclipse is at minimum. Each eclipse lasts about 10 hours centered on the time given. Two timezones are shown; the first is Greenwich, England and the second is local time based on the web browser that you are using. In the example show below the second timezone is -5 which is Eastern Standard Time.
01/18/2016 @ 15:22 UT 01/18/2016 @ 10:22 am
There is a tutorial on observing variable stars without a telescope at Citizen Sky project. The instructions describe how to estimate the brightness of the star. Observe it during the night of an eclipse and then again the next night or two. You should see a notable difference.
RZ Cassiopeiae
[edit | edit source]Plotting a light curve
[edit | edit source]Measurements of the change in brightness of a variable star are plotted to produce a light curve.
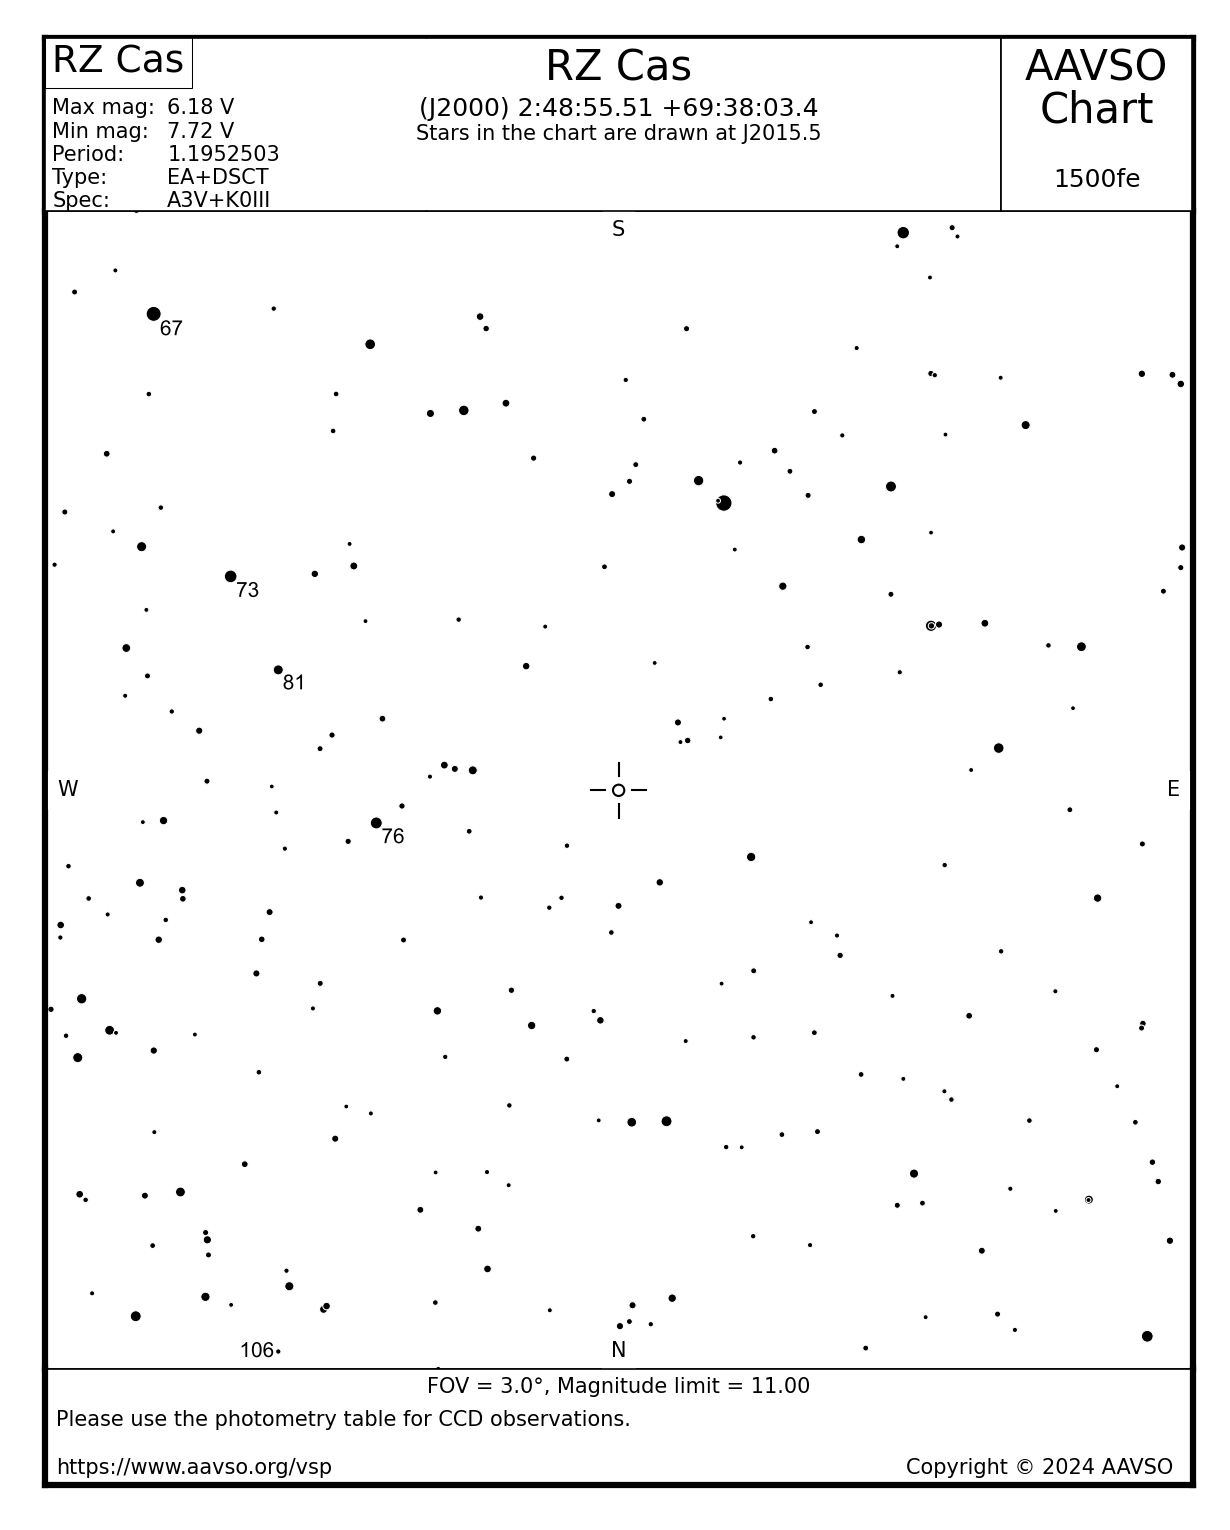
The next star we'll look at is similar to Algol. It is another eclipsing binary called RZ Cassiopeiae, or RZ Cas. It is much dimmer than Algol and can only be seen with a binoculars or a small telescope. The eclipses occur every 1.2 days.
A series of measurements were made with a small telescope using a CCD camera with a Johnson B filter. The images were analyzed to extract the brightness of the star on the magnitude scale. Here is the light curve which shows most of the eclipse.

For this activity we will use free software called VStar.
- Visit this website and click on the Download VStar Now button to run the program.
- Then go to Observational_astronomy/RZ_Cas and copy the preformatted data and save it to a file named rz_cas.csv on your computer.
- In the VStar program select File and then New Star from File. Go to the directory where you saved the file and select it.
- Next select View and then Plot Control... Check the button labeled Means and change the Days per Mean Series Bin to
0.007and click Apply.
You should see an image similar to the one below.

The "Means" (shown in black) give an average of about 10 minutes of measurements. This is calculated from the 0.007 days that you entered above. Shorter vertical "error bars" indicate better quality for those data points.
We can compare these measurements to those from other observers. The plot below shows Johnson V band measurements from the American Association of Variable Star Observers along with the data from above. Observations from different eclipses can be shown on a "phase plot" to detect inconsistencies in the timing of the eclipse. [1]

Resources
[edit | edit source]- Detailed information about RZ Cas from the AAVSO VSX database
- O-C data for RZ Cas from MSO
- RZ Cas AAVSO finder chart 1500fe
- RZ Cas AAVSO finder chart X15733WU
- SU Cas AAVSO finder chart X15733AAV
References
[edit | edit source]- Lowder, Wayne M. (June 2006). "An Unusual Brightening of the Eclipsing Binary RZ Cassiopeiae". The Journal of the AAVSO 35 (1): 182-183. http://articles.adsabs.harvard.edu/full/2006JAVSO..35..182L. Retrieved 2015-12-28. "The eclipsing binary RZ Cassiopeiae showed an unusual brightening between JD 2450415 and 2450490. I discuss the possible meaning of this brightening, and suggest further monitoring of this fascinating star."
- Umbricht, Michael (2009-12-05). "VStar gets a workout". Citizen Sky. American Association of Variable Star Observers (AAVSO). Retrieved 2015-12-28.