
Mandelbrot set along the real axis and the orbits
| This resource includes primary and/or secondary research. Learn more about original research at Wikiversity. |
This article by Dan Polansky looks at behaviors of Mandelbrot set orbits along the real axis, that is, the behaviors of orbits for real-valued c parameters of the iterative function. The iterative function of the Mandelbrot set is an example of a quadratic map; sometimes it is called the quadratic map.[1] It is therefore a miniature study of the behavior of simple (real-valued/one-dimensional) non-linear discrete-time dynamical systems. For brevity, we will refer to the quadratic map of the Mandelbrot set as the Mandelbrot map.
A way to increase the learning effect is start with the Questions section and try to find the answers without reading the rest.
Introduction
[edit | edit source]Mandelbrot set is the set of all complex values c such that the iterative function f(x) = x ** 2 + c starting at 0 and iterating to f(0), f(f(0)), f(f(f(0)))), etc. is bounded rather than escaping to infinity. Since we are only looking at the real axis, c is a real value, which amounts to the same as being a complex value with the imaginary component equal to zero. An orbit for the initial value x0 is the sequence of values x0, f(x0), f(f(x0)), f(f(f(x0)))), etc.; in the Mandelbrot set, x0 = 0. Programmatically, an orbit for the Mandelbrot set is a sequence of successive values of x in a process of setting x to 0 and then repeatedly executing z := f(x), that is, x := x ** 2 + c.
One way to look at Mandelbrot set is as an examination of the behavior of deterministic discrete-time dynamical systems. A deterministic discrete-time dynamical system is a system evolving in time from an initial state that in general has different states in different time points, the time points are given by positive integers (the system makes steps) and there is a transition function specifying the next state given a current state. Thus, for real-axis Mandelbrot set, the system states are real numbers, the system has the initial state of 0, and the next state is given by the iterative function, x ** 2 + c. The dynamical system is parametrized with c, showing different behaviors for different values of c. Put differently, different values of c yield different dynamical systems, possibly with a radically different behavior.
The Mandelbrot set on the real axis is boring: it is the interval [-2, 0.25] with no intricate structure. However, from the standpoint of the dynamical system behavior, not all of these points are created equal since their orbits can look rather different. Some orbits smoothly converge to a fixed point, some show an oscillating behavior converging to an oscillation between two points, while other show rather chaotic behavior. The Mandelbrot set does not finely differentiate different kinds of orbits; it merely tracks whether the orbit is bounded (in the set) or not (outside the set). Nonetheless, the differentiation of orbits based on manner of convergence, oscillation, etc. is connected to the structures visible in the complex-plane Mandelbrot set along the real axis, including the main cardioid and the circle sequence attached to it, but also other cardioids on the real axis.
Questions
[edit | edit source]Before proceeding further, one can test one's knowledge and imagination by reviewing investigated questions, all pertaining to a real-valued c in [-2, 0.25]:
- Is there a c for which the orbit is constant? How many are they?
- For which values of c is the orbit a monotonic function?
- Are there values of c for which the orbit takes on a finite number of values? What are such examples?
- Are there values of c for which the orbit takes on a finite number of values for each count of the finite values?
- What are example values of c for which the orbit approaches an oscillation between two values?
- What are example values of c for which the orbit approaches an oscillation between four values and what are examples for eight values?
- What are example values of c for which the orbit is chaotic? What do we mean by "chaotic"?
- Given an arbitrary finite period (number of points among which the orbit oscillates in a converging manner), is there a value of c such that the orbit eventually converges to an oscillation with that period? This question is left without an answer in the following.
- To the main cardioid, there is a circle attached in the westward direction, and another smaller circle attached to that circle further westward, etc. Is there an infinite series of ever smaller circles resulting from indefinite extension of this westward, and if so, what are the periods of the real-axis points in these circles? This question is left without an answer in the following.
One can get an idea by plotting the orbits for various values of c in a spreadsheet (e.g. Excel) or using Python. However, these plots are a result of numerical mathematics and are thereby not conclusive about what is actually the case on the level of the actual mathematical precision.
Observations
[edit | edit source]Let us proceed to observations relating to the questions.
- For c = 0, we get a constant orbit: 0 --> 0 --> 0 --> 0 ...
- For 0 < c < 0.25, the orbit is monotonic and converges to a certain value. (What is the point of convergence depending on c?)
- For -0.75 < c < 0, the orbit is oscillatory but with decreasing amplitude and it converges to a certain value.
- We have thus covered the range [-0.75, 0.25], which matches the main cardioid in the complex-valued Mandelbrot set. There, the orbit always converges to a single fixed point, that is to say, has the period of 1.
- For -1.4011551890... (Feigenbaum point per maths.town) < c < -0.75, the orbit approaches oscillation on a 2-cycle (e.g. c = 1.1), 4-cycle (e.g. c = 1.3), an 8-cycle (e.g. c = 1.38) and other 2**n cycles if one believes the Mandelbrot set related information in Wikipedia: Feigenbaum constants. There, the largest 2**n tabulated is 1024, whereas MathWorld tabulates 2048 as highest, albeit for logistic map.
- For c = -1, the orbit oscillates between -1 and 0: -1 --> 0 --> -1 --> 0 --> ... This is a special case in the above interval for c, where the oscillation is exact rather than approximate/converging.
- For -2 < c < -1.4011551890..., one can see various chaotically (not periodically, not even in a converging manner) behaved orbits. Some orbits seem more regular, e.g. -1,75.
- It is not clear to me whether the orbits always eventually settle for a certain length of a period; if so, only a prefix of the orbit would be rather chaotic. What would suggest the settling-on-a-period hypothesis would be the idea that each point is located in a (sufficiently small) cardioid or disk, and each such cardioid or disk has a fixed period length; whether the idea is correct is unclear.
- For c = -2, we get an orbit that lands on the constant 2: -2 --> 2 --> 2 --> 2 ...
We can make further observations for real-valued c outside of Mandelbrot set (one can again plot the orbits for an impression):
- For c = 0.5, the orbit runs away in first 5 iterations.
- As c approaches 0.25 from above, one can have the orbit grow very slow for arbitrarily long time before it runs away/escapes. Why this is so becomes obvious from the cobweb plot: the parabola (x ** 2 + c) gets arbitrarily close to the diagonal (f(x) = x), creating an arbitrarily small gap near x = 0.5 through which the systems has to get from the left to the right (x starts at 0). And the smaller the gap, the greater the number of up-and-right steps needed to get past the gap, where the steps are illustrated in the cobweb plot.
- For c = 0,251, the orbit runs way after about 100 iterations. The orbit is a monotonic curve that starts at a steep slope, the slope quickly becomes increasingly less steep, and the orbit spends a lot of time very slowly growing, having about the value of 0.5, eventually gaining speed and rapidly escaping.
For a visual version of some of the above observations, see section Orbit time series plots.
Connection to the logistic map
[edit | edit source]The dynamical system point of view at Mandelbrot set provides a connection to the logistic map, both having the iterative function given by a quadratic function: f(x) = x ** 2 + c vs. f(x) = r * x * (1 - x). Wikipedia indicates that by proper substitution, one can get the Mandelbrot map from the logistic map quadratic function; one has to substitute not only the constant but also the x value. The logistic map is characterized by its orbit diagram/bifurcation diagram whose significant points correspond to points on the real axis that appear significant given the structure of Mandelbrot set in the complex plane. One would think that the results obtained from the study of the logistic map would carry over to the study of the Mandelbrot map in some way. Therefore, the rather detailed and comprehensive Logistic map Wikipedia article seems relevant in some way.
However, the orbit diagram/bifurcation diagram for the Mandelbrot map and the logistic map feature key differences, one of which is that the Mandelbrot map has only one chaotic region (for negative c) whereas the logistic map has two chaotic regions (one for positive r, one for negative r). Even if one disregards the negative-r portion of the logistic map, it is not obvious how to map the bifurcation period-doubling points of the logistic map to the bifurcation period-doubling points of the Mandelbrot map.
Further reading:
- Mandelbrot set, wikipedia.org -- section Basic properties briefly treats of the correspondence
- Logistic map, wikipedia.org
- Is the Logistic Map hiding in the Mandelbrot Set? by Desdenova, Aug 2023, youtube.com
- Relationship between Mandelbrot set & Logistic map by D cubed & J, youtube.com -- erroneously shows the orbit diagram/bifurcation diagram of the Mandelbrot map and states that it is one of the logistic map
Plotting the orbits
[edit | edit source]One can easily plot the orbits for real-valued c in Excel using formulas and charts (no VBA required). However, this poses a limit for numerical precision given Excel does not seem to have an arbitrary-precision floating-point arithmetic.
One can determine the orbits using Python's decimal library/module, which enables setting the decimal precision to an arbitrary--even if fixed--number. One can then plot the orbit using matplotlib. Alternatively, one could use Python's library for fractions/rational numbers, noting that if x0 and c are rational, then all zn are rational, albeit in general with rapidly increasing denominator. See sections Orbit time series plots and Orbit time series plots code. One may also write Python plotting code as an exercise.
Unless one desires a high precision, one may start in Excel:
- Keep column A for labels.
- Enter the value of c to cell B1, e.g. 0.25.
- Enter the initial value of zero to cell B2. The value of zero matches the Mandelbrot set definition. A different value can then be chosen to examine how the system converges to something from different initial values; this is related to the definition of Julia set.
- Enter formula =B2^2+B$1 into cell B3.
- Copy the formula from cell B3 to, say, 300 cells in the B column, in a spreading manner so that B4 has =B3^2+B$1, etc.
- Select B2 through B300, and create a line chart with markers for points.
- Play around with values of B1 and B2 (c and x0) and see how it impacts the chart showing orbit.
Further reading:
- mandelbrot-orbit by Jose Selano, github.com
Achieving mathematical precision
[edit | edit source]Plotting orbits in Excel or using Python is an exercise in numerical mathematics. A salient question is whether the results so obtained give a fairly accurate picture or could be misleading as a result of numerical errors. After all, the results are based on iterative application of the same function for many times (e.g. 1000 times), and numerical errors could accumulate. One can naturally ask what things about the orbits for real-valued c one knows mathematically, not just numerically.
Some relevant observations:
- One can easily prove that for c in [0, 0.25], the 0-starting orbit does not exceed 0.5.
- One can calculate the orbits of c = -1 and -2 and see that there are clearly no numerical errors.
- For c = -1.75 and x0 = 0.5, one sees the orbit oscillates between 0.5 and -1.5.
Questions:
- Can one mathematically (not merely numerically) prove statements about period lengths of the orbits that numerically appear to converge to 1, 2, 4, or 8 points?
Fixed points
[edit | edit source]One gets a certain kind of window on the orbit behavior by considering the fixed points of the defining iterative function, that is, x such that x = x ** 2 + c. (We are staying in the real axis, but fixed points can be considered in the complex plane as well.) A fixed point is thus a solution of the equation 0 = x ** 2 - x + c, and there are at most two fixed points for a given c. The iteration defining the Mandelbrot set starts at 0, but one can run the same iteration from a different point/value, and if one runs the iteration from a fixed point, it should stay constant bar numerical errors.
For c = 0, the fixed points are 0 and 1. These points have the power to attract nearby values, but not an unlimited power. If one starts the iteration from 0.9999 rather than 0, one can see how the fixed point 1 exercises its attractive power for a brief period of time, but then, the fixed point 0 prevails, dragging the orbit toward it. For starting points above 1, the attractive power of the fixed point 1 is too weak and these points go to infinity. We see that the fixed point 1 is unable to keep values in its vicinity, unlike the fixed point 0. The attractive power of the fixed point 0 is also limited. Starting at -0.9999, the orbit first lands near 1, but then the attractive power of 0 prevails. Starting at -1, the orbit lands on 1 and stays there. Starting at -1 - epsilon, the system escapes to infinity.
For c = 0.25, a fixed point is 0.5, and this is the point toward which the 0-starting iteration converges.
For c = -1, the 0-started system oscillates between 0 and -1, and thus, one might naively think these are two fixed points. However, that is not so: if it were so, the system would not oscillate between the points but rather stay on them as soon as they would be reached. There are two fixed points, -0.618... and 1.618..., both of which have a weak power of attraction: the system starting nearby that point (but within their interval) eventually converges to an oscillation between 0 and -1.
For c = -2, a fixed point is 2 and a 0-starting iteration lands on it immediately. If one starts the iteration from -2 + epsilon (arbitrarily close to -2 but greater), one can get an orbit that initially sticks to -2 for an arbitrarily long time but then goes into an apparently chaotic behavior. Another fixed point is -1. This fixed point also has the power to attract nearby values for a finite time, e.g. -0,999999, but eventually, the system departs into an apparently chaotic behavior.
For c = -1,9 iterating from 0, one can see the power of the fixed point to briefly attract values close to -0,97... approximately (that is the fixed point that is the counterpart of -1 for c = -2). One can ask: if one explores the orbit starting from 0 far enough, will one see indefinitely long sequences of points stuck very closely to the fixed point?
The fixed-point way of looking at things provides a look at the Mandelbrot set orbit calculation as a way of trying to numerically solve a quadratic equation by determining a corresponding iterative function for it (if it exists, which it does for non-zero b, given the form 0 = ax**2 + bx + c), starting at a random value, and iterating to see whether the orbit happens to converge. The above considerations show that this is not a good method: for many a starting point, the orbit goes to infinity, and even if it does not go to infinity, it may oscillate around 4 or 8 points or enter a chaotic behavior.
Periodic points
[edit | edit source]Periodic points are analogues of fixed points. A periodic point of period length 2 is x such that x = f(f(x)), and similarly for the general period length n. Thus, a fixed point is a periodic point for the length of 1. An alternative characterization is that a periodic point is a fixed point for function g defined as an n-iteration of function f.
One would think that the cases where Mandelbrot set orbits (starting at 0) oscillate between two or more points in a converging manner correspond to there being periodic points of the iterative function to which the oscillation converges.
Further reading:
- Periodic points of complex quadratic mappings, wikipedia.org
Cobweb plot
[edit | edit source]A way to visualize the orbits is using a cobweb plot, which shows the iterative function, the diagonal and then shows transitions from an initial value using the function and the diagonal. Wikimedia Commons does not seem to have any cobweb plot for Mandelbrot set (f(x) = x ** 2 + c), but it does have cobweb plots for the logistic map (f(x) = r * x * (1- x)). Cobweb plots for Mandelbrot map are shown in the video by Robert L. Devaney linked from further reading, starting at 17:25.
Orbit diagram
[edit | edit source]An orbit diagram, also known as bifurcation diagram, is a 2D plot that shows, for each value of the parameter of a map (e.g. c), the values visited by the orbit. Such a diagram may plot all initial orbit values, but it often does not plot all of them. Instead, one often calculates e.g. first 10,000 values of the orbit without plotting them and plots only the next 1,000 values. This kind of diagram helps investigate the kinds of orbit behaviors one may find, including orbit periods. Thus, one may see for which values of the parameter (e.g. c) the orbit converges to a single point, to a 2-cycle, a 4-cycle, an 8-cycle, a 3-cycle, etc., and also how fast it converges. Instead of a clear convergence, it also shows something like chaos for some values of the parameter, but the chaos contains further non-chaos when zoomed into.
The most classical orbit diagram shown and investigated is probably one for the logistic map. However, an orbit diagram for the Mandelbrot map makes equally well sense and is found e.g. in the video by Robert L. Devaney linked from further reading, starting at about 28:00. The two diagrams (one for the logistic map, one for the Mandelbrot map) look similar but are not identical; one difference is in mirroring but there are other differences.
Orbit diagrams/bifurcation diagrams, as well as Mandelbrot set with periods indicated:
-
 Mandelbrot set with periods indicated
 -
 Correspondence between the Mandelbrot set and an orbit diagram (but of which map?)
 -
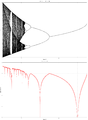 Orbit diagram for the Mandelbrot map, together with Lyapunov exponent
 -
 A low-resolution orbit diagram/bifurcation diagram for the Mandelbrot map (German)


Something seems not quite right in the 2nd image: the rightmost value seems to be as big as the leftmost maximum value. By contrast, the 3rd image looks plausible as being the orbit diagram/bifurcation diagram for the Mandelbrot map: the rightmost value is 0.5 while the leftmost values scatter the interval [-2, 2].
The following orbit diagrams of the Mandelbrot map do not exclude initial orbit values:


See also article Discrete-time dynamical system orbit diagram.
Plotting the orbit diagram
[edit | edit source]We can plot the orbit diagram/bifurcation diagram for the quadratic map of the Mandelbrot set (x ** 2 + c) using Python code adapted from Wikipedia: Logistic map, section Graphical representation to calculate the Mandelbrot map rather than the logistic map. Further changes were made.
Below, we choose to set lastMapIterationCountToPlot to the same value as mapIterationCount, thereby plotting the complete orbit rather than skipping its initial values. This approach--compared to the approach in which one plots only a certain number of the last values--does not make the result uninteresting or too confusing.
Proposed file name: mandelbrotMapOrbitDiag.py
Code:
import numpy as np
import matplotlib.pyplot as plt

saveFigure = True
markerSize = 0.001 # orig. 0.02
markerStyle = "," # . - point; , - pixel
cInterval = (-2.1, 0.26)
#cInterval = (-2, -1.99)
#cInterval = (-1.4011551890, -1.3940462)
cResolution = 0.0003 # (orig. 0.0001, 0.0003)
mapIterationCount = 1000  # (orig. 600)
lastMapIterationCountToPlot = 1000 # (orig. 200)
startingIterationValue = 0

lims = np.zeros(mapIterationCount)

fig, biax = plt.subplots()
fig.set_size_inches(16, 9)

lims[0] = startingIterationValue
for c in np.arange(cInterval[0], cInterval[1], cResolution):
    for i in xrange(mapIterationCount - 1):
        lims[i + 1] = lims[i] * lims[i] + c
        if lims[i] > 2:
            lims[i + 1] = lims[i] # Allow plotting c values outside of Mandelbrot set, diverging ones

    biax.plot([c] * lastMapIterationCountToPlot,
              lims[(mapIterationCount - lastMapIterationCountToPlot):], "b.",
              markersize=markerSize,
              marker=markerStyle)

biax.set(xlabel="c", ylabel="x",
         title="Mandelbrot set quadratic map for real values - bifurcation diagram/orbit diagram" + "\n" +
               "c resolution: " + str(cResolution) +
               ", iteration count: " + str(mapIterationCount) +
               ", last values to plot count: " + str(lastMapIterationCountToPlot))

if saveFigure:
    plt.savefig("MandelbrotMapOrbitDiag.png", dpi=600)
else:
    plt.show();
Further reading:
- Bifurcation diagram, wikipedia.org
Bifurcation parameters
[edit | edit source]The term "Bifurcation parameter" and the following table is adapted from Wikipedia; it does not trace to any source.
The bifurcation parameters are the values of c for which there is a period doubling, before the values of c enter the chaotic region. However, the chaotic region is not chaotic at all its subregions: there is the 3-cycle subregion where we again see repeated period doubling, multiple 5-cycles, etc.
These values should be well visible in the Mandelbrot set: they are the locations at the real axis where a smaller circle attaches to a larger circle or, for the first value, the cardioid.
| n | Period = 2n | Bifurcation parameter (cn) | Ratio = |
|---|---|---|---|
| 1 | 2 | -0.75 | — |
| 2 | 4 | -1.25 | — |
| 3 | 8 | -1.3680989 | 4.2337 |
| 4 | 16 | -1.3940462 | 4.5515 |
| 5 | 32 | -1.3996312 | 4.6459 |
| 6 | 64 | -1.4008287 | 4.6639 |
| 7 | 128 | -1.4010853 | 4.6668 |
| 8 | 256 | -1.4011402 | 4.6740 |
| 9 | 512 | -1.401151982029 | 4.6596 |
| 10 | 1024 | -1.401154502237 | 4.6750 |
| ∞ | -1.4011551890... |

It is to be suspected that the above figures are typically irrational and that therefore one should add "..." above as applicable.
An assignment: write Python code (or in other language) that is going to calculate the bifurcation parameters, and is going to numerically explore the hypothesis that the period doubling never ends.
Further reading:
- Feigenbaum constants, wikipedia.org
Orbits with finite value count
[edit | edit source]Most orbits take on a countably infinite number of distinct values and merely approach a finite (or sometimes infinite?) set of attracting points. But some orbits take only a finite number of distinct values, e.g. for c = 0 (0) and c = -1 (0, -1).
A hypothesis: for all positive integers n there exists a value of c such that the 0-starting orbit takes on exactly n distinct vaues.
Assignment: expand the following list for more values of n.
The values of c can be numerically discovered by plotting the orbit diagram/bifurcation diagram and noticing where lines intersect the 0 axis (since the system starts at 0, 0 is always in the finite set of distinct values). This suggests that the value of c is the solution for the n-th times iterated Mandelbrot map equal to zero. Thus, for n=2, we get the polynomial equation c**2 + c = 0, and the sought c is a solution to that equation.
We can numerically search for the value by using the Excel calculation of the orbit described elsewhere in this article and then tweaking c to minimize the absolute value of the value x_n-1 (since that value would be 0 when we hit the c perfectly, given x_0=0).
Example c for different n (found numerically, risk of being wrong):
- n=1: c=0
- n=2: c=-1
- n=3: c=-1.754877...
- n=4: c=-1.310702..., -1.940799
- n=5: c=-1.625413..., -1.860782..., -1.985424...
- n=6: c=-1.476014...
- n=7: c=-1.674066...
- n=8: c=-1.810001...
- n=9: c=-1.785865...
- n=10: c=-1.887172...
- n=11: c=-1.732006...
Assignment: How many c values are there for each n? Could it be that there is only one satisfying c for n=1, n=2 and n=3, but not for n=6? Could it be that for n that is a prime number, there is exactly one c leading to exactly n distinct values (no; can you show why)?
Assignment: Let us consider the set of all c such that the 0-starting c-orbit has finite set of distinct values. Does the set densely cover the interval [-2, Feigenbaum point]? A set densely covers an interval if for each arbitrarily small subinterval of it, some element of the set lies in that subinterval.
One can search for the values of c yielding an exact cycle numerically using Python (but the results are inconclusive since numerical):
import random
len=13 # At least 3; 2 is not in the chaotic region.
# Works for lens that are prime; for compound len, it can find a smaller cycle.
# Works for len=4 since 2 is not found in the chaotic region.
# For longer cycles, working with normal float is probably too imprecise
precision = 1E-7
bestDelta = 0.1
print "len:", len
while bestDelta > precision:
  c = random.uniform(-2,-1.4)
  x = 0
  for i in range(len):
    x = x * x + c
  if abs(x) < bestDelta:
    bestDelta = abs(x)
    print("better c:", c)
    print("better delta:", bestDelta)
print("c:", c)
print("best delta:", bestDelta)
Orbits attracted to finite value count
[edit | edit source]Many orbits are attracted to a finite set of value, convergingly oscillating between the values. For instance, 0.25 is attracted to 0.5. To define this formally: an orbit is attracted to a finite set of values a_1, ..., a_k, if, for each epsilon, there exists i such that all values x_i, x_i+1, ... lie within epsilon-regions of a_1, ..., a_k.
Period-free orbits
[edit | edit source]A period-free orbit (or "aperiodic" orbit) is one that is not attracted to a finite set of values. The name "aperiodic" is arguably a bit misleading: it is very usual for an orbit to have no period in that it has an infinite number of different values, but it is also usual to converge to a finite set of values in a periodic manner.
Question: Are there values of c such that the orbit is not attracted to a finite set of values? If such values of c exist, they would lie in the chaotic region. However, values of c in the chaotic region that upon numerical examination display non-periodic behavior could in fact be attracted to a finite, albeit very large sets of values.
From sources, it seems that the above question is an open problem, but perhaps an expert would refute this notion.
Observation: Each orbit visits only a countable set of values, and therefore, no orbit can perfectly cover a full interval of real numbers. However, an orbit with countably-infinitely many values (a typical case) could well densely (but not fully) cover a region/interval. Since experimental zooming in into the orbit diagram/bifurcation diagram never reveals a vertical block of pixels that stays solid upon subsequent zooming, this would suggest an orbit never densely covers an interval of values, no matter how small an interval, but this is merely an unverified hypothesis.
One could write software to numerically explore the hypothesis that there are no period-free orbits. One would keep on randomly picking the values of c; that's the obvious part. For each c, one would try to show that for a large chosen number of iterates n, there is a set of values much smaller than n to which the values are attracted. The details are not obvious; perhaps this is an interesting exercise. If it is true that for each positive n, there is a c whose orbit has the period of n (converges to a set of size n), it should be easy to randomly hit astronomically large n. A numerical examination would seem unlikely to be able to distinguish astronomically large periods from genuinely aperiodic orbits.
One unverified hypothesis states that each real c lies in a circle or a cardioid in the Mandelbrot set and that the c values in the circle or cardioid have the same period (along the real axis but also in the complex plane). If this is so, there are no aperiodic orbits, only orbits with very high asymptotic period. Again we are talking asymptotic period, not a period of a perfect cycle with a finite number of values.
Orbit periods
[edit | edit source]By orbit period we will denote the size of the set of values to which the orbit is attracted/to which it converges. Thus, the period of the range [-0.75, 0.25] is 1, the period of -1 is 2, etc.
To find out periods of various values of c, we may inspect the orbit diagram. However, the chaotic region reveals only a small set of periods to visual inspection.
We could adapt a program plotting the Mandelbrot set to estimate the period lengths for the points not escaping to infinity, and plot different period lengths at different colors. Then, zooming in the Mandelbrot set along the real axis would reveal the periods of disks and cardioids along the real axis.
The proposal above was implemented by José Celano Martín. However, the period detection seems rather imperfect. A look at the orbit diagram/bifurcation diagram reveals the likely cause: as one approaches the point of bifurcation, the convergence seems to slow down. Thus, e.g. the points in the main cardioid that are near the main attached disk can erroneously be determined to be of orbit 2.
Another implementation is by J. C. Sprott in PowerBASIC, and the image it produces with inner Mandelbrot set points color based on the calculated period appears satisfactory.
Further reading:
- Detecting periodic orbits in the Mandelbrot Set by José Celano Martín, linkedin.com
- Mandelbrot Set Chaos by J. C. Sprott, sprott.physics.wisc.edu
Orbit time series plots
[edit | edit source]The following plots show the initial parts of orbits for various values of c. Unlike the orbit diagram/bifurcation diagram, which can be used in conjunction with them, they give a clear picture of development in time.
For c > 0.25, the orbit can take some time to escape, but eventually it will:

By making the value of c arbitrarily close to 0.25 from above, the orbit can take arbitrarily long to escape.
A monotonic convergence to a single point:

A quick oscillatory convergence to a single point:

A much slower oscillatory convergence to a single point:

A period of 2:

A period of 2 near a bifurcation point; there is a 2nd-level damped oscillation for each of the two points of convergence:

A period of 4:

A period of 8:

A chaotic orbit whose values are constrained to certain intervals:

A period of 3:

A period of 3 interrupted with chaos:

A period of 3 interrupted with chaos, with much briefer interruption:

It seems one can make the near-periodic initial segment arbitrarily long by setting c arbitrarily close to the edge of the period-3 window of the orbit diagram; -1.75 lies in that window.
A chaotic orbit into which as if the ghost of period 3 leaks:

Some of the most chaotic values of c (one can see the action of the repulsive fixed point near -1):

Orbit time series plots code
[edit | edit source]The plots above were created using the following Python script. One may explore the orbit time series by trying different values of c and series length passed as parameters to the script.
# Argument: floating point c, or "selection"
import sys, decimal, matplotlib.pyplot as plt
decimal.getcontext().prec=100
dpi=300
cSelection = ["0.2501", "0.24", "-0.4", "-0.74", "-0.8", "-1.24", "-1.26", "-1.38", "-1.42", "-1.74991",
              "-1.74992", "-1.75", "-1.8", "-1.99"]
imageSuffix = ".svg" # can be ".svg", ".png", etc.
cStr = sys.argv[1]
seriesLen = 300
if len(sys.argv) > 2:
  seriesLen = int(sys.argv[2])
def plotC(cStr):
  c = decimal.Decimal(cStr)
  xSeries = [0] * seriesLen
  x = decimal.Decimal(0)
  xSeries[0] = float(x)
  for i in xrange(seriesLen - 1):
    try:
      x = x * x + c
      xSeries[i + 1] = float(x)
    except decimal.Overflow:
      xSeries[i + 1] = float("nan")
  # Output
  for i in xrange(seriesLen):
    print xSeries[i]
  # Plot
  fig, biax = plt.subplots()
  figSize = fig.get_size_inches()
  fig.set_size_inches(figSize[0] * 3/2, figSize[1])
  plt.rc('font', size=8)
  biax.plot(range(seriesLen), xSeries, ".-", linewidth=0.5, markersize=1)
  biax.set(xlabel="i", ylabel="x", title="Orbit time series for $f(x) = x^2 + c$; c=" + str(c))
  plt.grid(linewidth=0.25, color="#DDDDDD")
  cStr = str(c).replace(".", "p").replace("-", "m")
  fileName = "MandelbrotMapOrbitTimeSeries_" + cStr + imageSuffix
  plt.savefig(fileName, dpi=dpi)
if cStr == "selection":
  for cStr in cSelection:
    plotC(cStr)
else:
  plotC(cStr)
Combined Mandelbrot and Julia set
[edit | edit source]Since we are constrained to real values, we have the option of plotting something like a combined Mandelbrot and Julia set in a 2D diagram. On x-axis, we may track the value of c, whereas on y-axis, we may track the value of x0, the initial value. A point shall be black if an iteration starting from x0 using the parameter c does not escape within the chosen number of iteration steps. Of interest is probably the region [-2, 2] x [-2, 2].
Plotting this combination is left as an exercise to the reader at this point.
Other maps
[edit | edit source]One can have a look at other broadly similarly shaped maps and their orbits, using the same Excel method described above. These would include the logistic map, a cosine map, a tent map, etc.
Attractor
[edit | edit source]We may expand the vocabulary with "attractor". We could let the term "attractor" refer to a finite set of points to which the Mandelbrot map is attracted for a given c. This terminological choice is not sourced, and whether this is a conventional terminology would need to be clarified. The term is used in the context of continuous-time dynamical systems, but its use in the context of discrete-time dynamical system needs to be researched.
Lyapunov exponent
[edit | edit source]There is an image of Lyapunov exponent in a different section of this article. This indicator seems somehow related (positively or negatively) to the rate of convergence; needs a verification and expansion.
Further reading:
- Lyapunov exponent, wikipedia.org
- Lyapunov Exponents for the Logistic Map, demonstrations.wolfram.com
Pseudorandom number generation
[edit | edit source]Von Neumann suggested using the logistic map 4 * x * (1 - x) for pseudorandom number generation.[2] Corresponding to this would be using the Mandelbrot map x**2 + c for c=-2 as a pseudorandom number generator, which, without modification, would result in range -2 to 2 and show non-uniform behavior near values 2, 0 and -2; starting from 0, -2 or 2, we would land on 2 and stay there. To improve upon this, one could start in the interval [-1, 1] and modify the output to stay in [-1, 1] (if out > 1: out = out - 1; if out < -1, out = out + 1).
An exercise: examine to what extent this is a good random number generator. That is, find out desiderata for random number generators, randomness tests, etc. and use them to evaluate this generator. Alternatively, find an article online discussing the properties of this kind of pseudorandom generator.
See also
[edit | edit source]References
[edit | edit source]- ↑ Quadratic Map, mathworld.wolfram.com
- ↑ Logistic Map, mathworld.wolfram.com
Further reading
[edit | edit source]Wikipedia and Commons:
- Mandelbrot set, wikipedia.org
- Feigenbaum constants, wikipedia.org
- Logistic map, wikipedia.org
- Commons: Category:Real quadratic map
Non-Wikipedia:
- What is the Mandelbrot set?, plus.maths.org
- The Real Line of the Mandelbrot Set, maths.town
- Displaying the Internal Structure of the Mandelbrot Set by Adam Cunningham, 2013, acsu.buffalo.edu
- Prof. Chip Ross Bifurcation and Orbit Diagrams Home Page, abacus.bates.edu
- Transition to Chaos: The Orbit Diagram and the Mandelbrot Set, Robert L. Devaney, SciMedTV, youtube.com
- The Logistic Map, complexity-explorables.org -- interactive orbits (time series) and cobweb plots, albeit for logistic map
- Quadratic Map, Wolfram MathWorld
- Logistic Map, Wolfram MathWorld
- The Road to Chaos is Filled with Polynomial Curves by Richard D. Neidinger and R. John Annen, The American Mathematical Monthly, 1996
- Douglas Hofstadter, Metamagical Themas -- covers the subject of the logistic map and its chaotic behavior