
MakerBot PLA Material
Problem
[edit | edit source]The MakerBot Replicator 2 is a popular 3D printer, available for less than $3000. The printer is capable of printing functional parts from a biodegradable thermoplastic material known as PLA (polylactic acid). The goal of this project is to design and implement a set of tests, in order to experimentally determine the material properties of the PLA material.
-
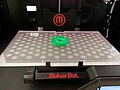 MakerBot Replicator 2
 -
 Three point bending test


Conceive
[edit | edit source]Conception is informally described above. A number of material properties could be important for 3D printed parts:
- Strength
- Stiffness
- Hardness
- Ductility
Each of these material properties could depend on one or more of the following variables:
- PLA material color
- Fill direction (orientation on build platform of 3D printer)
- Infill percentage (setting on 3D printer)
- Temperature
- Moisture/Humidity
- Load duration (creep) or repetition (fatigue)
Initially, this project investigates strength and stiffness as functions of material color and fill direction.
Design
[edit | edit source]The goal of the design phase is to design a set of test plans for determining PLA material properties.
Requirements for each test plan
[edit | edit source]The tests that pass to the implement phase must:
1. be feasible.
2. be economically viable.
3. have reproducible results.
4. be general enough to test multiple variables.
5. not have over 10% error.
6. identify essential material properties in discovering the limitations of PLA.
|
Experimental prototypes and testing conducted during design
[edit | edit source]
The first prototype of the 3 point bend test can be seen to the right. The setup consists of two raised triangular blocks supporting the test specimen and a level. A clamp is applied to the center point of the beam and a string is tied to the clamp. Weights are measured with a bathroom scale and tied to string. Deflection of the beam is measured by hand with a small ruler for each weight and recorded. These values were then used to calculate the elastic modulus of each data point and percent error was recorded. The percent error of the wood specimen recorded was around 40%, breaking one of our initial requirements. In order to track the source of error and reduce it a second material was tested, Cpvc pipe. After the second trial percent error was reduced to around 23%. While this value was still outside of our range it was still plausible to improve the experiment and meet requirements with the next design.
The final test plans
[edit | edit source]Two test plans were developed, a 3-point bending test and a 2-point bending test. The 3-point test is used to determine the material's stiffness, while the 2-point test is used to determine the material's strength. Both tests require PLA test specimens with dimensions L=220 mm x W=10 mm x H=5 mm.
Below are the finalized experimental procedures to be used for testing. It is our hope they will be able to accurately measure the elastic modulus and ultimate strength of PLA and determine any factors that affect it, such as color, fill direction, and temperature.
- 3-Point Bending Test

When testing this procedure, the data and calculations recorded can be seen in this example: 3 pt Example

The final design of the 3-point bending test, seen to the right, is very similar to our initial prototype. The process was maintained and improved upon significantly reducing sources of error. To begin with, labeled hanging masses were used in the experiment leading to a calculated value of force incorporating very little error. Next, the clamp was removed and simply replaced by a loop at the end of the string, this assures the load will be concentrated at the direct middle of the beam. Lastly, and most importantly, the method of measuring was altered. Before beginning the test, paper is mounted behind the beam and the initial position is marked, this becomes the base line for measuring deflection. Hanging mass is then added and a deflection line is drawn. This is repeated for several data points in order to incorporate an average value. Once all data points are drawn the paper is removed. The distance between the base line and each deflection point is measured with vernier calipers and recorded. After conducting a dry run of this design, the calculated percent error was around 6%, well within our requirements.
- 2-Point Bending Test

Technical and scientific knowledge
[edit | edit source]Being that our goal was to design a scientific method in order to calculated the material properties of PLA, formulas were an essential part of our research.
|
|
Implement
[edit | edit source]Goals for implementation performance, cost and quality
[edit | edit source]1. Tests must be economically feasible. This goal was met, after using many resources from the engineering lab the testing total did not exceed $20.
2. Repeatable results. This goal was met, multiple trials (ranging from 10 to 20) of a single beam were conducted leading to similar results.
3. Accurate test data. This goal was met, all measures were taken to reduce error including many trials and accurate measuring devices.
Manufacturing the test specimens
[edit | edit source]

The main tool used in the implementation process was the Makerbot Replicator 2. The multiple test specimens used in the 2 point and 3 point bending procedures were first modeled in solid edge. The picture on the left shows the simple rectangular beam with dimensions 220mm x 10mm x 5mm. This model was then uploaded to Makerware where its printing options were modified and then exported to the printable .x3g file. When testing fill direction this model was rotated and contracted to produce a Lxh model and a wxh model, beam fill directions shown to the right.
Test setup
[edit | edit source]A variety of tools were required for testing: hanging weight sets (large and small), vernier calipers, rulers, clamps, and materials used to build vertical supports. The only material purchased was the two pine triangular supports, $3.50 each from a local hardware store.


Shown above is the set-up of the 2 point and 3 point testing procedure set-ups. The 2 point procedure, shown in the center, consisted of a very simple set of parts. Once a beam was chosen a hole was drilled into one end at which a string was strung through and tied. A clamp borrowed from the lab was then used to secure the other end in a fixed location. Large weights, also borrowed from the lab, were then used to apply a force to the beam. The basic 3 point procedure, shown on the left, was used for nearly all 3 point trials. Empty bins located in the lab were used to symmetrically suspend the triangular supports which held a beam and a level. Secured to the level was a blank sheet of paper used to mark the beam's initial position and deflection for each mass added. While this simple set-up was ideal for any beam with a lxw or lxh fill direction, the constricted length of a wxh beam and increased amount of needed mass was not supported in this set-up. Instead, two 2x4 wooden beams supported by bins were used to suspend the triangular supports which in turn held a beam and the level. This set-up can be seen pictured to the right.
Variability and Statistical Analysis
[edit | edit source]Due to human error and other random factors, experimental values were not always similar. To avoid this error multiple test trials were conducted and averages were taken. These average were then compared by means of statistical analysis in order to determine if differences were statistically significant.
|
|

Testing and analysis procedures
[edit | edit source]The first test performed was the 3-point bending test. This procedure was used to determine PLA's modulus of elasticity and to investigate any variable that could affect it. A brief procedure of the 3-point test can be seen below, summarized from the test passed along from the design phase. This brief procedure describing one trial was repeated for the desired number of trials ranging from 10 to 20.
|
|
The second test performed was the 2-point bending test. The procedure seen below was used to determine PLA's ultimate stress.
|
|


Summary of results
[edit | edit source]Stiffness dependence on PLA color, from most stiff to least stiff
[edit | edit source]Clear (2.77 GPa) > Luminescent > Blue = Black > Green = Red (2.55 GPa)
The overall variation between colors is less than 10%.
Strength dependence on PLA color, from highest to lowest strength
[edit | edit source]Black (105 MPa) = Green > Clear > Red (87 MPa) >> Glow (54 MPa)
Glow-in-the-dark PLA is an outlier, as the other colors vary by about 20%.
Stiffness dependence on PLA color, from most stiff to least stiff
[edit | edit source]LxW = LxH > WxH
Beams are approximately 20% less stiff when printed in the WxH orientation. This corresponds to an upright (vertical) orientation on the build plate when 3D printing.
Comparison of PLA strength and stiffness to other common materials
[edit | edit source]
By characterizing the strength and stiffness of PLA, future students will be able to make an educated choice when determining which color and direction to print their project parts. By having an easy to access list students will be able to choose the best combination for their desired effect. For example, if they worry about the strength of the part more than its stiffness a group should print the part in neon green, as it is able to endure the highest amount of stress. On the other hand if a group is printing a part in which the bending of a part would produce failure, they should print this part in clear and with the fill direction opposed to the undesired bending, this would produce a part with the largest modulus of elasticity or the stiffest part.