How force field analysis is presented in a figure?
Back to ID Homepage > ID force field analysis > What is force field analysis? > How force field analysis is presented in a figure? > How force field analysis is used?
Driving Force VS. Restraining Force
[edit | edit source]Think about the example of Harry Potter and say we are expecting that Harry defeated Voldemort. Then probably a stronger power, a fatal magic, and support from his families are the needed effects that can help achieve this expectation. If these factors happened, they could be viewed as driving forces that support and lead Harry to his goal. On the other hand, Voldemort’s power is viewed as restraining forces that resist or decrease Harry’s power. The same concept can be applied to force field analysis which has two parts - driving force and restraining force.
- Driving force: the force favoring the proposed change or keeping it going
- Restraining force: the force resisting change or keeping the status quo
How is FFA Presented?
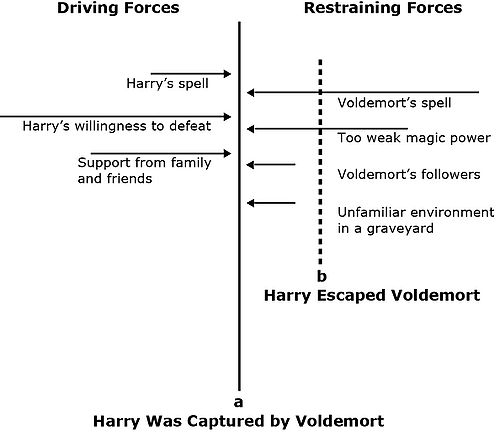
[edit | edit source]According to Lewin’s point, organizations are systems in which the current situation is not static but dynamic with forces working in opposite directions. There are always both driving forces that push for change and restraining forces that act against change in any situation. When one does an analysis, these two forces are shown in balance, like Harry and Voldemort, in a visual depiction that looks like this:

This graphic is one of the representations of force field analysis. Let’s relate the graphic to the Harry Potter video and say, Harry is currently at ‘a’ and wants to move to the situation of ‘b.’ Those driving forces helping him such as the family’s support and his willingness are shown as the arrows pointing toward ‘b.’ However, the arrows from opposite direction represent Voldemort’s power against Harry.
In the organization development, driving forces and restraining forces are represented by arrows with opposite directions. The strength of each force is represented by the length of its representative arrow. In this graphic, the position of ‘b’ is desired change, and several forces operating within the organization or outside the environment may make movement towards ‘b’ desirable or undesirable.
Questions
[edit | edit source]
Now, you have known what driving force and restraining forces are and how they are presented in a graphic. Before moving forward, let’s review a case study for practice and see how force field analysis is applied in a bicycle manufacturer.
Click the Next button to practice and review the case.
| ID Homepage | ID force field analysis | < Back | Next > |
