Heat Map
Appearance

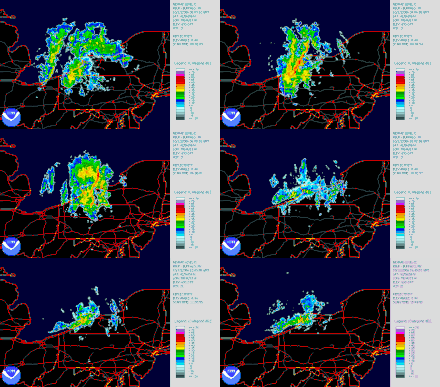
A Heatmap understood literally shows the temperature difference on map, i.e. the color blue represents cold areas (e.g. North Pole) and areas with red colors represent hot area (e.g. Sahara). If we expand this concept of heat to other domains (e.g. risk maps) "cold" areas represent areas with low risk and red areas represent areas with high risks. A color scale is used to represent different intensity of a considered property. A heatmap for rainfall represents the amount of water reaching the surface by percipitation. In general a heatmap is spatial representation of the intensity of a quantified property.
Learning Task
[edit | edit source]- Explore the different types of heatmap and the application on Wikipedia.
- For this learning resource a heatmap editor was implemented. It allows the exploration of an webbased generation of a heatmap. The heatmap editor does not store any user generated data on a server (see AppLSAC), so save the JSON file on your computer. Explore the earthquake heatmap first.
- Now create you own heatmap by following the workflow below.
Workflow HeatMap Editor
[edit | edit source]- Download openlayer_heatmap.zip[1] and unzip to a folder of your choice (e.g.
Documents/openlayer_heatmap). - Check out the example heatmap in (e.g.
Documents/openlayer_heatmap/HeatMap/index.html) - Start HeatMap Editor
- Add a new record to heatmap database by pressing the
Add-button - Press
Select Geolocation-button, zoom in and find Rome in Italy and click of Rome in the map (the geolocation is selected). - After the selected geolocation is return to the HeatMap editor, set the name
Romeand the value20. - Save the JSON-file for further editing or sharing the data with others (because data is stored in the browser only).ou will find a file
mapobject.jsonin your Download Folder of the browser. - Save heatmap XML data by pressing
Save HeatMap Data. You will find a fileheatmap_data.kmlin your Download Folder of the browser. There might be more than one file. The browser might enumerate the filesheatmap_data_3.kml. Copy the file toDocuments/openlayer_heatmap/HeatMap/heatmap_data.kml. If the file contains a number rename the file. - Start
Documents/openlayer_heatmap/HeatMap/index.htmlagain to see you new heatmap.
See also
[edit | edit source]References
[edit | edit source]- ↑ GitHub repository for the HeatMap Editor for the Wikiversity Learning Resource by Engelbert Niehaus (2018) - https://github.com/niebert/openlayer_heatmap (accessed 2017/01/08)
