Functions (mathematics)/Graphs
Graphing a function
[edit | edit source]In mathematics, the graph of a function f is the collection of all ordered pairs (x, f(x)). If the function input x is a scalar, the graph is a two-dimensional graph, and for a continuous function is a curve. If the function input x is an ordered pair (x1, x2) of real numbers, the graph is the collection of all ordered triples (x1, x2, f(x1, x2)), and for a continuous function is a surface.
Examples
[edit | edit source]You can plot the functions whose arguments and values are numeric. For instance
x: -3 -2 -1 0 1 2 3 y: -3 -2 -1 0 1 2 3
- Straight line on the right
x: -3 -2 -1 0 1 2 3 y: 3 2 1 0 1 2 3
- Straight line on the left
x: -3 -2 -1 0 1 2 3 y: 3 2 1 0 1 2 3
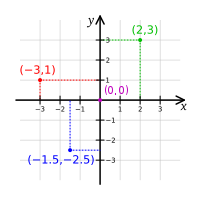
A Cartesian coordinate system is a coordinate system that specifies each point uniquely in a plane by a pair of numerical coordinates, which are the signed distances to the point from two fixed perpendicular directed lines, measured in the same unit of length. Each reference line is called a coordinate axis or just axis of the system, and the point where they meet is its origin, usually at ordered pair (0, 0). The coordinates can also be defined as the positions of the perpendicular projections of the point onto the two axes, expressed as signed distances from the origin.
A point on Cartesian coordination will be A (x,y) . Where x represents length in x direction and y represents length in x direction
In mathematics, the polar coordinate system is a two-dimensional coordinate system in which each point on a plane is determined by a distance from a reference point and an angle from a reference direction.
A point on Cartesian coordination will be A (r,θ) . Where r represents length in r direction and θ represents angle of incline
Cartesian to Polar coordination
Polar to Cartesian coordination
Function types and their graphs
[edit | edit source]- Trigonometry function
- Absolute function
- Linear function
- Quadratic function
- Polynomial function
- Exponential function


