Empirical functions/Wind power/Exercise
Appearance


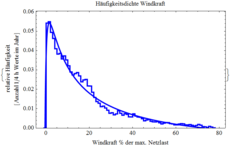
Determine for the following diagrams which empirical mappings they describe. What is in each case the source, the target, which units are used? Does each image represent one or more mappings? Do they really represent mappings? What information is conveyed beyond the mapping? Is there some kind of mathematical modelling for these empirical mappings?
