Artificial Consciousness/Neural Correlates/Neural Maps
Neural Maps
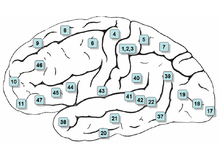
One of the problems that scientists have had to solve was the lack of map-ability of the Nervous System, especially in the brain where connections seem opportunistic, and are so dense as to allow literally tens of thousands of connections to a single neuron. Although the selectionists came up with mechanisms that allowed neurons to self-organize into neural groups, there seemed to be a gap between neural groups, and the order that had allowed the neurosurgeons to do mapping of gross cerebral function. The current state of the art in mapping at this gross level is the Brodmann Area Map
(It should be noted that while this map has been well published it has been condemned by some researchers due to the fact that the data on which it was based was never published.)
The solution to the gap between Neural Groups and Gross Level maps, came in two stages,first Teuro Kohonen invented a type of neural network called a Self-Organizing Map (SOM) and then Dr. Edelman showed how reentry could create an environment in which such maps could form naturally.
(Note to self, may have this backwards should check sources.)
Although Kohonen's maps are 2 dimensional and are usually used for visualization of higher dimensional data, The main characteristic of these maps is their ability to reduce the dimensionality of complex data. The choice of the dimensionality of the output, is really dependent on the nature of the data being evaluated, and the human penchant for thinking in 4 dimensions (3 spatial dimensions plus time) may simply be because there has been classically no need for more dimensionality in our Neural Maps, and so we have not developed it.
In his book The Remembered Present: A biological Theory of Consciousness Dr. Edelman suggests that these naturally forming SOM's are allowed to some extent to overlap and thus compete for attention. Although there is as yet no adequate explanation why these maps tend to congregate in certain areas of the brain, it is thought that there might be a relationship between the placement of the reentry connections in the brain and where the maps form.
In his book Self Organizing Maps Dr. Kohonen indicates how using such a map, makes possible the learning of the representation of movement in the brain, and how it can be used to drive a robot arm. Experiments using such techniques have proven useful, and some researchers have shown how they can use such technology to teach a monkey to think a robotic arm into position in order to give themselves a treat.
Brodmann Areas Map


Brodmann Areas: These areas are probably specialized Maps within the Cerebral cortex
Brodman Areas (* Not all shown on maps)
- Brodmann Area 1, 2, 3 Primary Somatosensory Cortex
- Brodmann Area 4 Primary Motor Cortex
- Brodmann Area 5 Somatosensory Association Center
- Brodmann Area 6 Premotor Cortex, Supplementary Motor Area
- Brodmann Area 7 Somatosensory Association Center
- Brodmann Area 8 Frontal Eye Fields
- Brodmann Area 9 Dorsolateral Prefrontal Cortex
- Brodmann Area 10 Anterior Prefrontal Cortex
- Brodmann Area 11/12 Orbitofrontal area
- Brodmann Area 13/14* Insular Cortex
- Brodmann Area 15* Anterior Temporal Lobe
- Brodmann Area 16*
- Brodmann Area 17 Primary Visual Cortex(V1)
- Brodmann Area 18 Secondary Visual Cortex(V2)
- Brodmann Area 19 Associative Visual Cortex(V3)
- Brodmann Area 20 Inferior Temporal Gyrus
- Brodmann Area 21 Middle Temporal Gyrus
- Brodmann Area 22 Superior Temporal Gyrus
- Brodmann Area 23 Ventral Posterior Cingulate Gyrus
- Brodmann Area 24 Ventral Anterior Cingulate Gyrus
- Brodmann Area 25 Subgenual Cortex
- Brodmann Area 26 Ectospenial Cortex
- Brodmann Area 27 Piriform Cortex
- Brodmann Area 28 Posterior Entorhinal Cortex
- Brodmann Area 29 Retrosplenial Cingular Cortex
- Brodmann Area 30 Cingular Cortex
- Brodmann Area 31 Dorsal Posterior Cingulate Cortex
- Brodmann Area 32 Dorsal Anterior Cingulate Cortex
- Brodmann Area 33 Anterior Cingulage Cortex
- Brodmann Area 34 Anterior Entorhinal Cortex
- Brodmann Area 35 Preihinal Cortex
- Brodmann Area 36 ParaHippocampal Cortex
- Brodmann Area 37 Fusiform Gyrus
- Brodmann Area 38 Temporopolar Area
- Brodmann Area 39 Angular Gyrus
- Brodmann Area 40 Supramarginal gyrus
- Brodmann Area 41/42 Primary & Associative Auditory Centers
- Brodmann Area 43 SubCentral Area
- Brodmann Area 44 ParaOperculus
- Brodmann Area 45 Pars Triangularum
- Brodmann Area 46 Dorsolateral Prefrontal Cortex
- Brodmann Area 47 Inferior Profrontal Gyrus
- Brodmann Area 48 Retrosubcular Area
- Brodmann Area 49 -
- Brodmann Area 50 -
- Brodmann Area 51 -
- Brodmann Area 52 Para-Insular area
While the mapping is organized by cell mapping studies using different types of stains, the different types of neurons likely form Neural Groups that have at least similar functions. However we can't determine from the cytoarchitecture exactly which neurons are involved in which maps. As Dr. Edelman states, Neural Groups are interchangeable, within these larger areas. Part of the confusion as to what each of these areas does, comes from the fact that only certain of these areas are involved in primary sensory stimulation, other areas have to be recruited before they begin to process the stimuli. Part of the problem with this is that we might not stimulate the recruitment requirements in lab conditions, and so we may not know what some of the areas actually do.
One Caveat that must be added to this mapping concept, is that Dr. Edelman uses it outside the Cerebral Cortex, other organs may not operate by the same rules as the cerebral cortex, so I tend to question the broad application of things like re-entry, in other organs.
