File:Anscombe's quartet 3.svg

Original file (SVG file, nominally 990 × 720 pixels, file size: 59 KB)
| This is a file from the Wikimedia Commons. The description on its description page there is shown below.
Commons is a freely licensed media file repository. You can help. |
| Description |
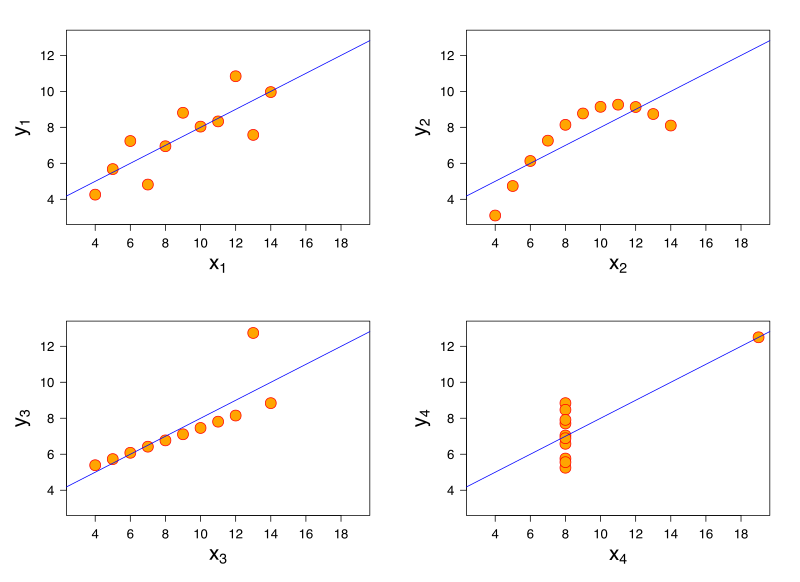
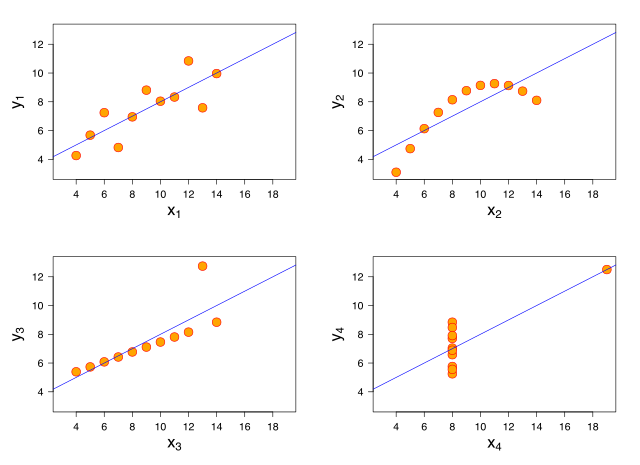
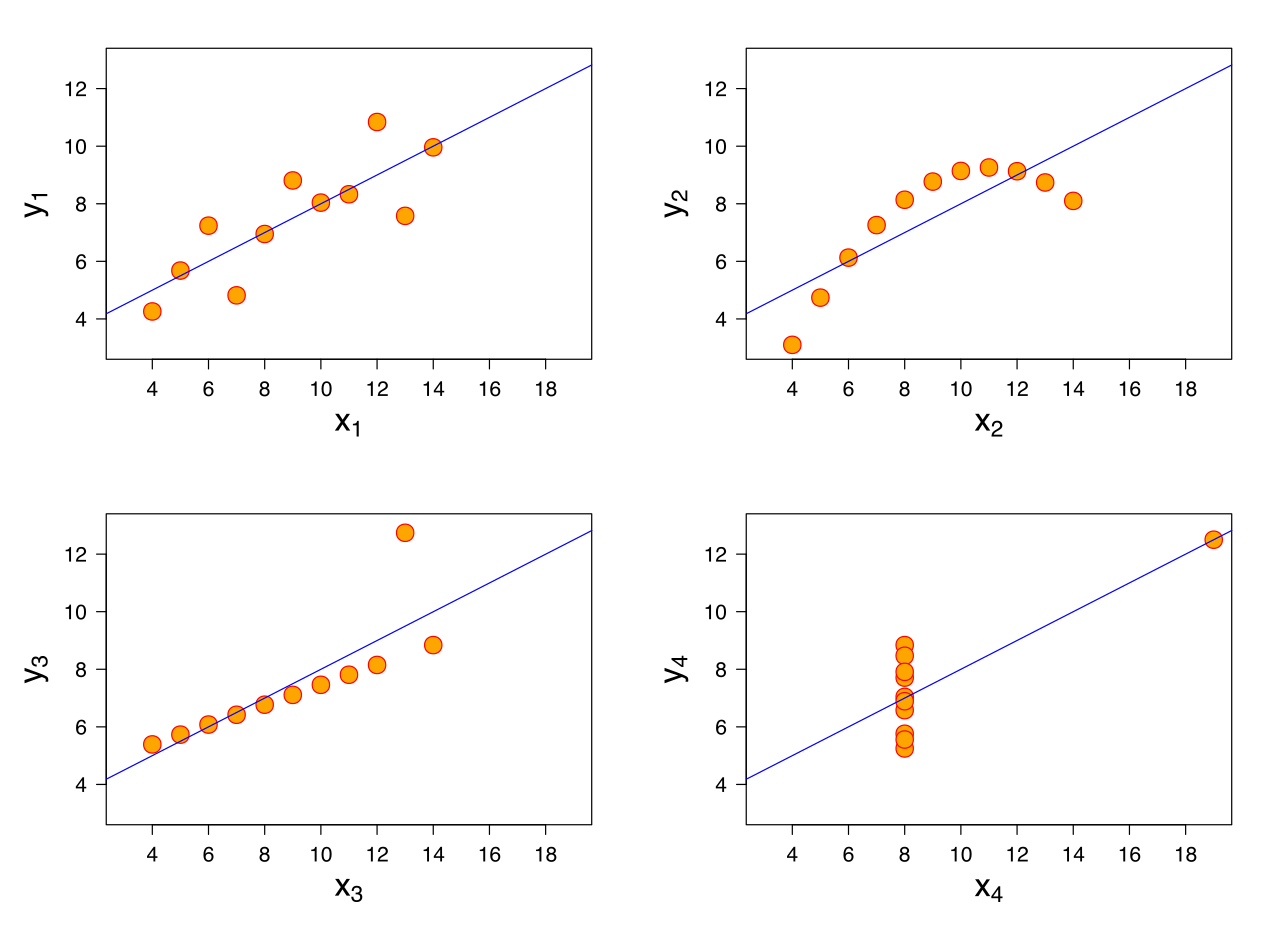
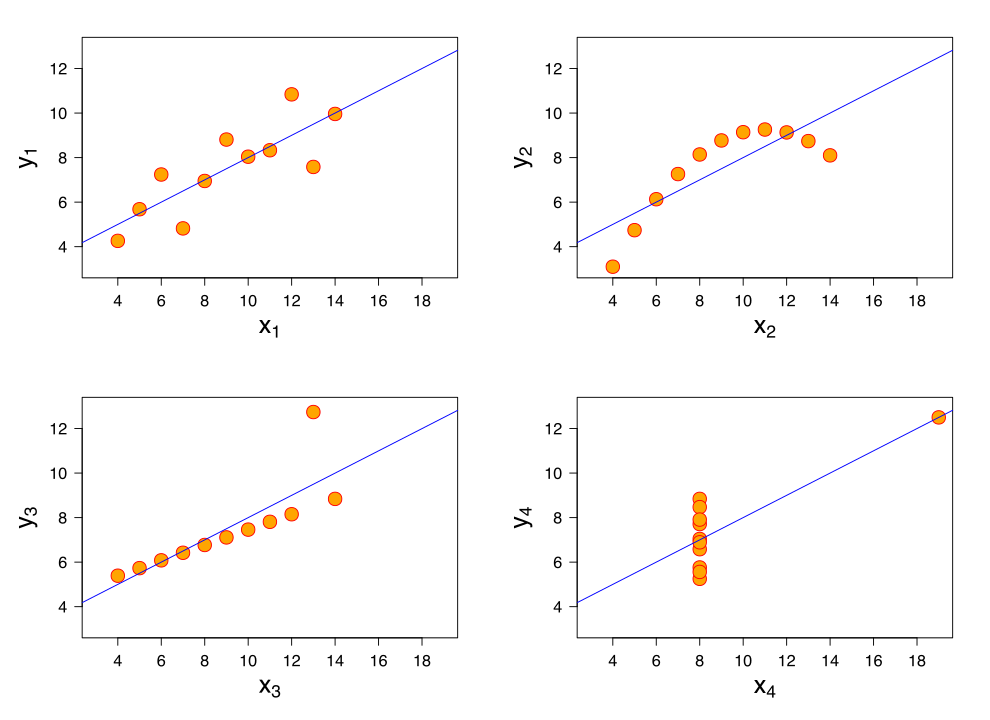
This graphic represents the four datasets defined by Francis Anscombe for which some of the usual statistical properties (mean, variance, correlation and regression line) are the same, even though the datasets are different. Reference:
|
||||||
| Date | (UTC) | ||||||
| Source | Anscombe.svg | ||||||
| Author |
|
||||||
| SVG development | This graphic is derived from earlier work by Schutz and the R development core team. As far as their rights and licensing allow, I license my contribution under the all the following licenses. The GPL is the only one I am sure applies.
| ||||||
| Source code | R codeR code to create the graphic:
svg("Anscombe's quartet 3.svg", width=11, height=8)
op <- par(las=1, mfrow=c(2,2), mar=1.5+c(4,4,1,1), oma=c(0,0,0,0),
lab=c(6,6,7), cex.lab=2.0, cex.axis=1.3, mgp=c(3,1,0))
ff <- y ~ x
for(i in 1:4) {
ff[[2]] <- as.name(paste("y", i, sep=""))
ff[[3]] <- as.name(paste("x", i, sep=""))
lmi <- lm(ff, data= anscombe)
xl <- substitute(expression(x[i]), list(i=i))
yl <- substitute(expression(y[i]), list(i=i))
plot(ff, data=anscombe, col="red", pch=21, cex=2.4, bg = "orange",
xlim=c(3,19), ylim=c(3,13)
, xlab=eval(xl), ylab=yl # for version 3
)
abline(lmi, col="blue")
}
par(op)
dev.off()
|

|
This work is free software; you can redistribute it and/or modify it under the terms of the GNU General Public License as published by the Free Software Foundation; either version 2 of the License, or any later version. This work is distributed in the hope that it will be useful, but without any warranty; without even the implied warranty of merchantability or fitness for a particular purpose. See version 2 and version 3 of the GNU General Public License for more details. |
- You are free:
- to share – to copy, distribute and transmit the work
- to remix – to adapt the work
- Under the following conditions:
- attribution – You must give appropriate credit, provide a link to the license, and indicate if changes were made. You may do so in any reasonable manner, but not in any way that suggests the licensor endorses you or your use.
- share alike – If you remix, transform, or build upon the material, you must distribute your contributions under the same or compatible license as the original.
|
|
Permission is granted to copy, distribute and/or modify this document under the terms of the GNU Free Documentation License, Version 1.2 or any later version published by the Free Software Foundation; with no Invariant Sections, no Front-Cover Texts, and no Back-Cover Texts. A copy of the license is included in the section entitled GNU Free Documentation License. |
Original upload log
This image is a derivative work of the following images:
- File:Anscombe.svg licensed with GPL
Uploaded with derivativeFX
File history
Click on a date/time to view the file as it appeared at that time.
| Date/Time | Thumbnail | Dimensions | User | Comment | |
|---|---|---|---|---|---|
| current | 17:18, 26 March 2010 | | 990 × 720 (59 KB) | Avenue | Increase size of axis titles |
| 17:09, 26 March 2010 |  | 990 × 720 (59 KB) | Avenue | {{Information |Description=This graphic represents the four datasets defined by Francis Anscombe for which some of the usual statistical properties (mean, variance, correlation and regression line) are the same, even though the datasets are different. |So |
File usage
The following 2 pages use this file:
Global file usage
The following other wikis use this file:
- Usage on ar.wikipedia.org
- Usage on ca.wikibooks.org
- Usage on cs.wikipedia.org
- Usage on cy.wikipedia.org
- Usage on de.wikipedia.org
- Usage on el.wikipedia.org
- Usage on en.wikipedia.org
- Correlation
- Anscombe's quartet
- Talk:Anscombe's quartet
- Frank Anscombe
- Wikipedia:WikiProject Statistics
- User talk:Schutz
- Wikipedia:Featured pictures thumbs/21
- Wikipedia:WikiProject Mathematics/Recognized content
- Wikipedia:Featured picture candidates/Anscombe's quartet
- Wikipedia:Wikipedia Signpost/2010-04-05/Features and admins
- Wikipedia:Featured picture candidates/April-2010
- Wikipedia:Featured pictures/Sciences/Mathematics
- User talk:Avenue/Archive5
- Wikipedia:Picture of the day/December 2011
- Template:POTD/2011-12-11
- Wikipedia:Main Page history/2011 December 11
- Wikipedia:Help desk/Archives/2011 December 11
- User:Kazkaskazkasako/Books/Mathematics
- User talk:Avenue/Archive2011
- Wikipedia:WikiProject Statistics/Featured content
- Influential observation
- Portal:Mathematics/Selected picture
- Wikipedia:Wikipedia Signpost/Single/2010-04-05
- Linear regression
- Wikipedia:Reference desk/Archives/Mathematics/2016 February 21
- User:Ajmehta21/sandbox
- Portal:Mathematics/Selected picture/24
- Portal:Mathematics/Recognized content
- Usage on eo.wikipedia.org
- Usage on et.wikipedia.org
- Usage on fa.wikipedia.org
- Usage on hy.wikipedia.org
- Usage on it.wikipedia.org
- Usage on ja.wikipedia.org
- Usage on jv.wikipedia.org
- Usage on ko.wikipedia.org
View more global usage of this file.